Income & Expense Report: Share your feedback here!

With the new Income & Expense Report that's available in Early Access to all users on the Web App, we want to hear from you! Please comment below to let us know how this report enhances Quicken Simplifi for you. Please also let us know if you see any issues!
For more details, please see our announcement here:
-Coach Natalie
Comments
-
Hey, it looks great, and I like it a lot. Thanks!
Steve
Quicken Simplifi (Safari & iOS) Since 2021
Quicken Classic (MacOS) Since 2009
MS Money (1991-2009) and Dollars & Sense (1987-1991)1 -
One thing I'm not sure is "right":
The savings account balances over time: they are the balances minus the savings goals.
Do you know if this was a design decision?
It may not be ideal for me, as I can't see actual balances in savings over time.
However, I like the new feature overall and will use it frequently.
-Rob
Edit: having the savings goals themselves as accounts on this list might be an alternate way todeal with this.
—
Rob Wilkens
0 -
Overall it's a nice update. I don't see the ability to "compare" in a graph format like Mint had. For example, spend YTD Vs. the same period last year in a graph with the ability to deep dive by category.
1 -
@Coach Natalie — Is this report available in QBP?
I turned Early Access back on but I don't see it.
I still see the "Net Income" report that it apparently replaces.
DryHeat
-Quicken Classic (1990-2020), CountAbout (2021-2024), Simplifi (2025-…)0 -
Omg. This is an excellent report! For me, this will become one of the most visited pages in the whole Simplifi app. Indeed, it reads like a personal finance P&L. I couldn't ask for anything more relevant and useful.
You guys absolutely nailed it. This report alone raised the value of the overall product.
Thank you!
4 -
@DryHeat, the Report isn't available in QBP. QBP has the Profit & Loss Report instead. This is an enhancement to the personal-only Quicken Simplifi, and is targeted toward personal finances.
Thanks!
-Coach Natalie
1 -
@Coach Natalie "the Report isn't available in QBP. [It] is targeted toward personal finances."
QBP stands for "Quicken Business & Personal." It should not be a surprise that I use it for personal finances as well as business. My need for personal finance reporting is not lessened by the fact that I upgraded to QBP.
Your New Feature Alert makes clear that the new report is a significant enhancement for personal finances.
It makes little sense to deny QBP users the ability to take advantage of this improved reporting. QBP is supposed to increase business finance features, not reduce personal finance features. An enhancement targeting personal finances is equally applicable to those who manage their personal finances in QBP.
If QBP is going to lag behind QS in personal finance features, or worse, be permanently crippled, I would like to revert to QS. Please let me know how to do that.
DryHeat
-Quicken Classic (1990-2020), CountAbout (2021-2024), Simplifi (2025-…)0 -
@DryHeat, I think there may be some confusion. QBP has the Profit & Loss Report, which does the same thing. If you want to use the Profit & Loss Report for your personal finances in QBP, you can set the Usage to 'Personal' —
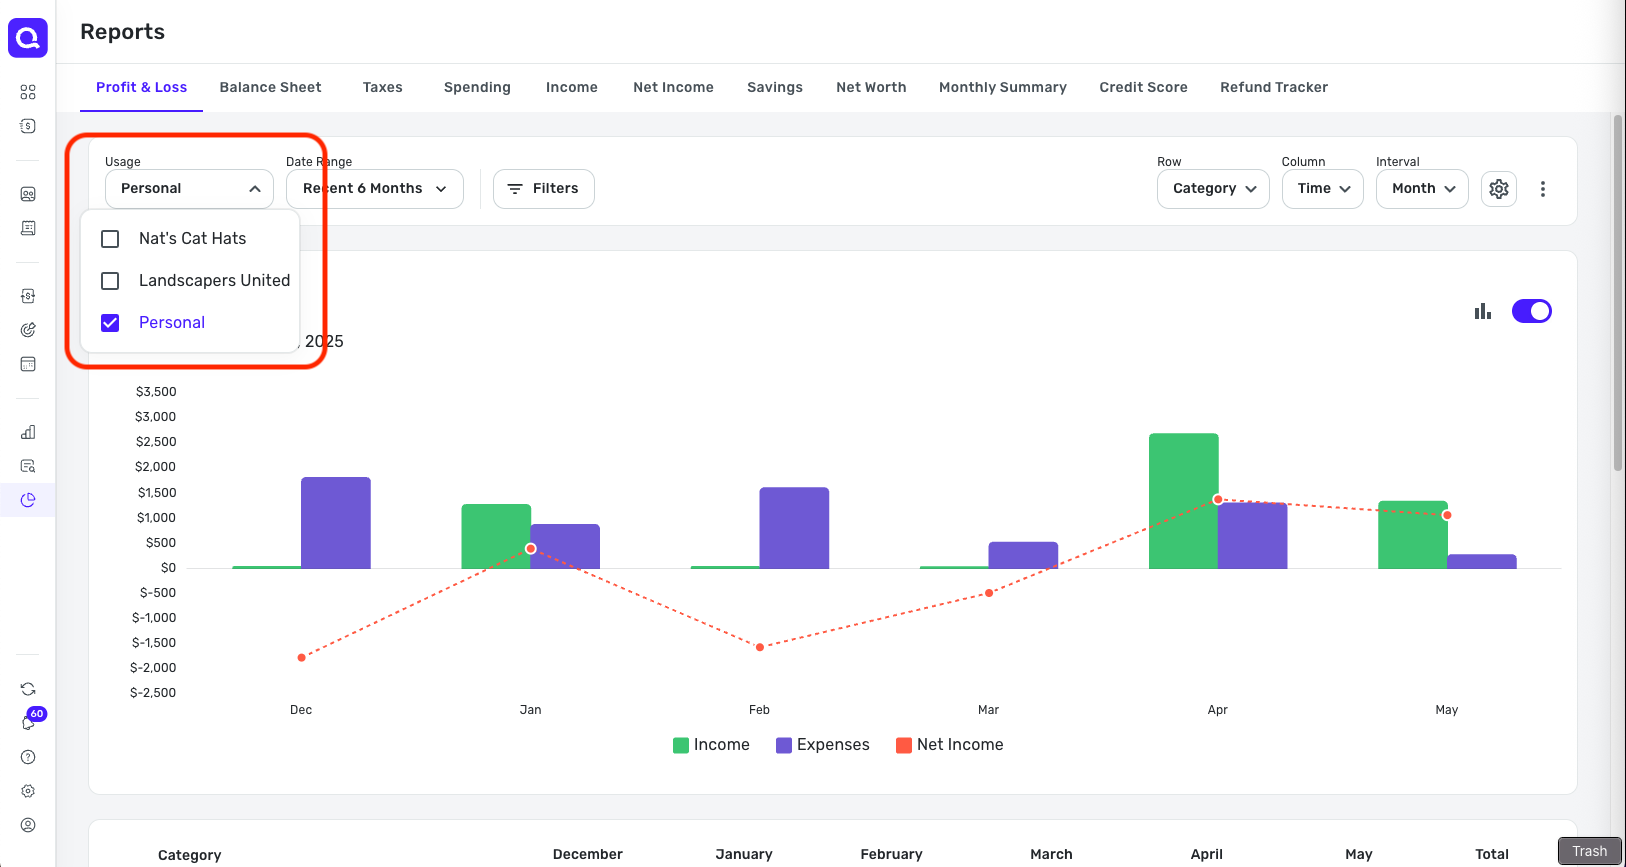
QBP has had the Profit & Loss Report all along, with the ability to use it for personal finances. So yes, the Income & Expense Report that was released in the personal-only Quicken Simplifi is indeed an enhancement to reporting for personal-only users.
If you'd like to inquire about switching subscriptions, you would want to do so by contacting Chat Support directly:
I hope this helps clear things up!
-Coach Natalie
0 -
So, the new Income & Expense report is actually the QBP Profit & Loss report, renamed and available in QS?
When you said the I&E report "wasn't available" in QBP and that QBP had the P&L instead, I didn't realize you meant that the two were the same thing.
Anyway, I take it that the new I&E report has no additional features not present in the P&L.
In which case, as Emily Litella used to say, "Never mind."

DryHeat
-Quicken Classic (1990-2020), CountAbout (2021-2024), Simplifi (2025-…)2 -
I want to report a bug in the Income & Expense report. The positive numbers / everything in green are wrongly included in the report. In this case, the mortgage payments are wrongly presented as a credit under Loans, while the actual transaction is reported correctly as a debit under Mortgage. I assume this is because Simplify reads (a) the actual payment leaving the checking account, as it should, hence the debit. Then it also reads the credit at the mortgage lender, which is technically correct, but doesn’t belong in the report. Similarly, the real estate tax payment from the lender is reported as a credit, which is wrong, since (a) it’s not a credit for either me or the lender except for the city who receives it, and (b) the monthly mortgage payment already accounts for real estate taxes through escrow. According to that report, I had credits of over 30k (everything in green), which I didn’t have.


I’ve tried to exclude all those positive numbers from the reports but Simplify tells me they cannot be excluded since the account cannot be modified. My only option is then to delete each transaction to clean up the report. These positive transactions should not show in the report.
0 -
@jorder, thanks for posting to the Community!
I went ahead and merged your post with the official feedback thread for the new Income & Expense Report. I have reached out to our product team to see if we can get some insight on how this should look in this type of report, and will let you know what I find out.
In the meantime, can you elaborate on what you mean by "they cannot be excluded since the account cannot be modified"? What type of account are the positive transactions in? Are they considered Linked Transfers? Is the mortgage account connected to the bank, or are you tracking it manually? What steps are you taking to exclude the transactions?
Please let us know!
-Coach Natalie
0 -
I agree with @Willowbean. It's an ok update for that report, but I don't really use that report very much if at all. The truely game changing update would be for the for the Spending report to compare a previous period with the current period in a graph format like Mint. That report alone would justify the increase in the Simplifi cost for me. I use that report way more often than the Income and Expense report.
6 -
This is awesome - exactly what I've wanted. I've been recreating this in Excel.
2 -
Thanks @Coach Natalie. It’s not a manual account; it pulls just fine from the bank as all my other accounts. Interestingly, the credits only show in that report, and not when I click on the mortgage account in the account list. In fact, when I do that, I get a blank window telling me that this account only shows the balance and doesn’t support showing transactions, which is fine by me, except that now that’s not true anymore since that particular report does show mortgage transactions, just not the ones it should. In any case, as for excluding, I tried to exclude the credits from spending plan, and/or exclude from reports, by choosing the respective boxes in the editing window for that transaction, but when I try to save it, I see the below. It would have been a quick fix to simply exclude these credits from the report but it’s not supported. Just to reiterate: these credits only show up in that particular report, they do not show when selecting the long list “Transactions” view - there, everything is correct, showing just the debits from my mortgage payments.
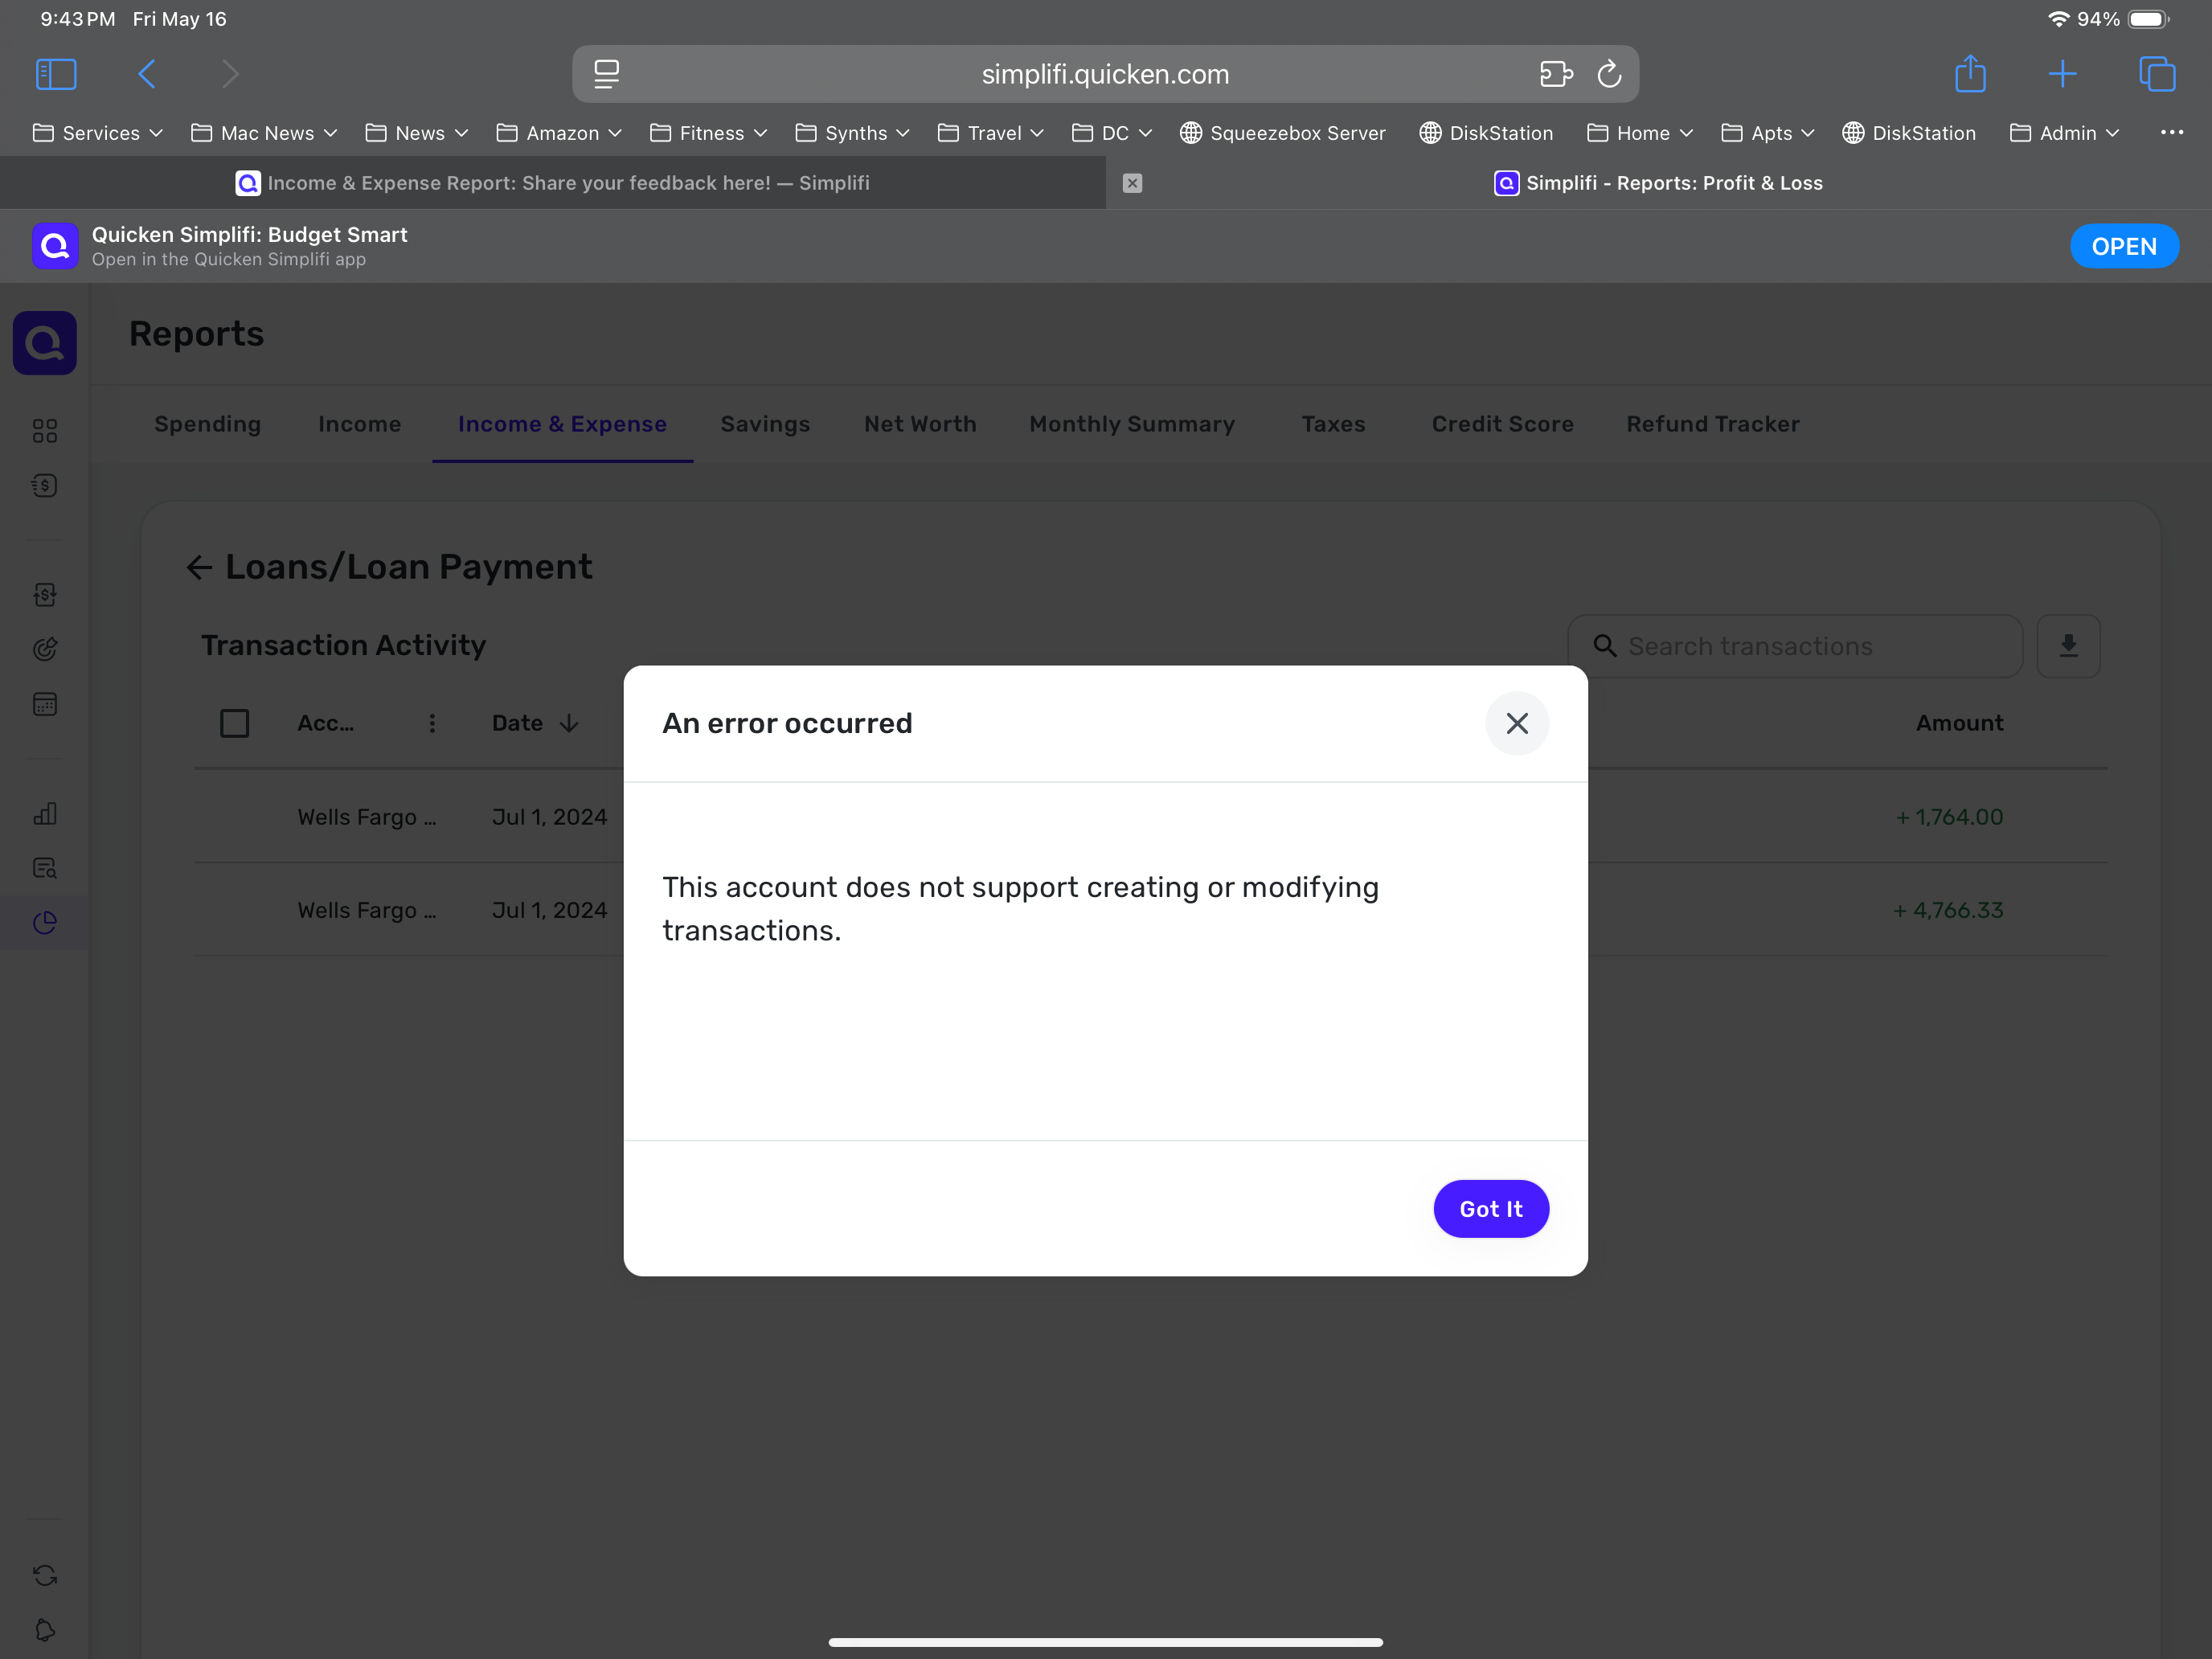 0
0 -
I am excited for this update and hope that it will continue to be enhanced! Having spent some time with it, here are several possible errors and general feedback about the UI experience so far.
Possible Issues
- Imported transactions for liability accounts are included. Imported transactions on my car loan are seen under Personal Income on the report, which seems to reflect the principal portion of payments as income. These transactions are not accessible from the Account or Transactions page currently. (I think this may be what @jorder is experiencing above?)
- In the details of the Personal Income generic line item, there are transactions already represented in another subcategory under Personal Income. This may be a side effect of third tier categories showing items both in the correct category and in the details of an incorrect category. No example has been identified under an Expense category, so it is uncertain whether this issue is global or isolated to income.
- CSV export includes totals/subtotals (particularly second tier category totals) as detail rows and should not.
General Feedback
- The report focuses heavily on net income in a traditional accounting sense rather than expense trending.
- More graphical representations of the data would be beneficial. There is a LOT of information (which is WONDERFUL) but it is difficult to absorb in the current format. An interactive area chart for trend data allowing selection and highlighting of different data points to display or drill into further detail would be helpful.
- Sorting columns to find larger values more easily would be useful. Solutions for totals/subtotals would be needed for this feature. Another option could be conditional formatting or filters or graphs to see the top percentages of income and largest expenses.
- Totals/subtotals for second level categories visually resemble detail rows, making it harder to separate visually, especially if the alternate row color option is selected.
- Negative expenses (e.g., reimbursements) display in green, which is visually helpful. Displaying income in green could also be beneficial.
- Display settings should remain consistent across sessions (i.e. be sticky).
- Several other column options were tried, but Time is the only one that seems helpful. Other options result in too many columns requiring excessive scrolling to be useful.
Overall, this is a great add to the system!
2 -
I’d like to emphasize the display setting consistency point mentioned by @Jenny T and add to that a customizable Date Range for all report that is saved and remains consistent as well. All reports default to the last 6 months, which doesn’t work for me for various reasons. I use the reports every day, several times a day, which makes changing the date range every single time cumbersome. Can we have a setting for default?
2 -
I love it. Well, there's a part of me that doesn't love it…it does a pretty good job of showing the truth of our current hole. However, I still love it.
One thing I'd recommend which is sorta related would be to perhaps highlight or label these as specifically for QBP (QBP Profit & Loss, QBP Balance Sheet). That would help those of us like @DryHeat better distinguish between what's QBP and what's Simplifi.

Chris
Quicken Simplifi user since 2021.
Quicken Desktop user since 2014.
Spreadsheet user since forever.1 -
@jorder Ran into the same problem where mortgage payment transactions are being included in the income & expense report even though they are not supported. If you navigate to settings, accounts and edit the mortgage account there, you can mark to exclude from spending plan and reports. The loan payment line will still show in the income & expense report but the amount will be zero.
0 -
-
@Coach Natalie Did the developer team already make changes in the meanwhile? I deleted the erroneous entries for this and last year so they're gone, but going back further, the entries don't show anymore and I hadn't deleted them. Was a fix already applied? Maybe the other users with the same issue can let us know.
1 -
Hi Jorder, I don't think we've made any changes. We're still investigating the issue. I'm sorry we missed this. Thank you for all your help pinpointing the issue and testing various things out but please refrain from making any big changes to try to work around the problem. I'm guessing we'll have a fix this week but I'll keep everyone posted once we have a chance to look into this more.
0 -
This is exactly the report I was hoping for. An "Average" column right before "Total" would be perfect . Thank you!
3 -
@Coach Natalie I excluded the liability account as suggested and that corrects the totals at the main report level. However, I do still see the transactions in the details when I drill into the line item. I think this could still cause confusion since those transactions are not accessible elsewhere in the system. I am not seeing these particular transactions on any of the other existing reports currently, so it does still seem to be isolated to the new report.
On a related note, these transactions were showing under Personal Income as the only items at the primary category level. After making the change to the liability report settings, I do still see the Personal Income line with a $0 total. I think this is actually related to the sub-category transactions showing in the details under that main category line item, as I also noted in my prior post. While these transactions are technically under that main category, I wouldn't expect to see those transactions in that view since they are not included in the report line-item total.
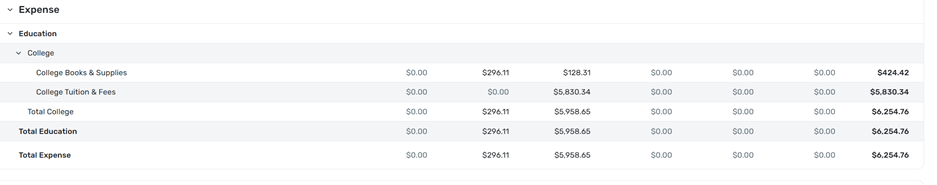
Below is my current income category structure. None of the transactions are categorized at the primary "Personal Income" level. However, the line item still shows on the new report for $0 and if I drill into the transaction details, I see all of the transactions in the third-level categories (bonuses, paychecks, interest income, etc) even though they also show under the proper sub-category.
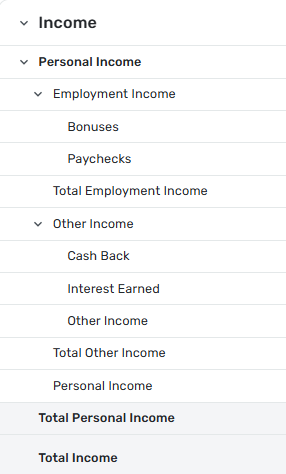
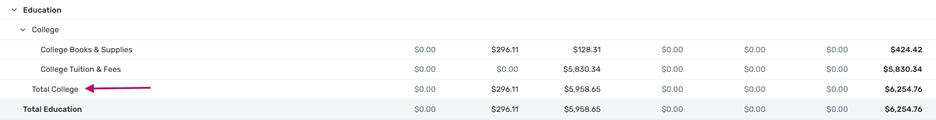
As I was looking for other similar examples, I also am finding that if you drill into any of the sub-total lines (i.e. Total Employment Income, Total Other Income, etc) that all transactions for the main category (i.e. Personal Income) are displayed. The sub-totals on the main report appear to be correct, the drill-in just isn't filtered correctly.
0 -
I have some income hidden from my total income. In the Income reports this is hidden. However, when I go to the Income&Expenses Report the hidden income shows up in my total income. This was not a problem before.
0 -
@moboja, thanks for posting to the Community!
I went ahead and merged your post with the official feedback thread for the Income & Expense Report. With that, can you elaborate on what you're referring to? How is the income in question being hidden or excluded from reports, and what do you mean by it shows up in the report? Are you perhaps referring to loan payments, as discussed above? Screenshots would be very helpful!
-Coach Natalie
0 -
A great update. Thanks!!!! Agree with the comments about needing sticky settings / save report options.
Rich W1 -
Nice! I like the option to look at categories and accounts over time. I could really use a button to collapse all to the 1st level category though (or account type). Most of the time I just need to see the detail level of "dining and drinks" not "fast food" vs "coffee shop" at a glance, but like having the full detail, when I want it.
3 -
I don't have time to read all the posts and be more detailed right now, my aplogies if this is a duplicate.
There is a huge mismatch in value between the total net of income and expenses in my Android app vs in the new report on the website. Phone shows $7K. Website shows $19k for the same period!
Comparing to the Total Spending and Total Income separate reports either the Android app or on the website, I see that the Income matches. However, the Spending side is missing about $12k out of $50k over the 6 month period.2 -
@Kseniya, thanks for posting
The difference you're seeing could be the difference in the Report. The Mobile App has the old Net Income Report, and the Web App has the new Income & Expense Report. However, I would think general income and net income would be the same. With that, I would suggest signing out and back into both locations so everything refreshes. If the issue persists, you will need to provide screenshots and more details so the Community can get a clear picture of what's going on.
-Coach Natalie
1 -
Hi! I just got access and this report is super! A few suggestions:
- Please, please please add "Last 12 Months" to the date range filter. I would also prefer that these "last" ranges start with the last full month so that they don't include a partial month of activity (i.e. the current month).
- The detailed table is awesome. I wish that anything with zeroes across the board could be hidden. Way too much noise for categories or payees that don't have any activity.
- I see that zeroes are greyed out to give visual distinction from non-zeroes. Making the zeroes dashes instead without the $ sign would be even better.
- When the table gets too wide to show on screen and there is a horizontal scrollbar, it's too large vertically to see the column headers while scrolling horizontally.
Thank you!
2