Two-year quarterly Profit & Loss report bar graph only shows bars for first 4 quarters only

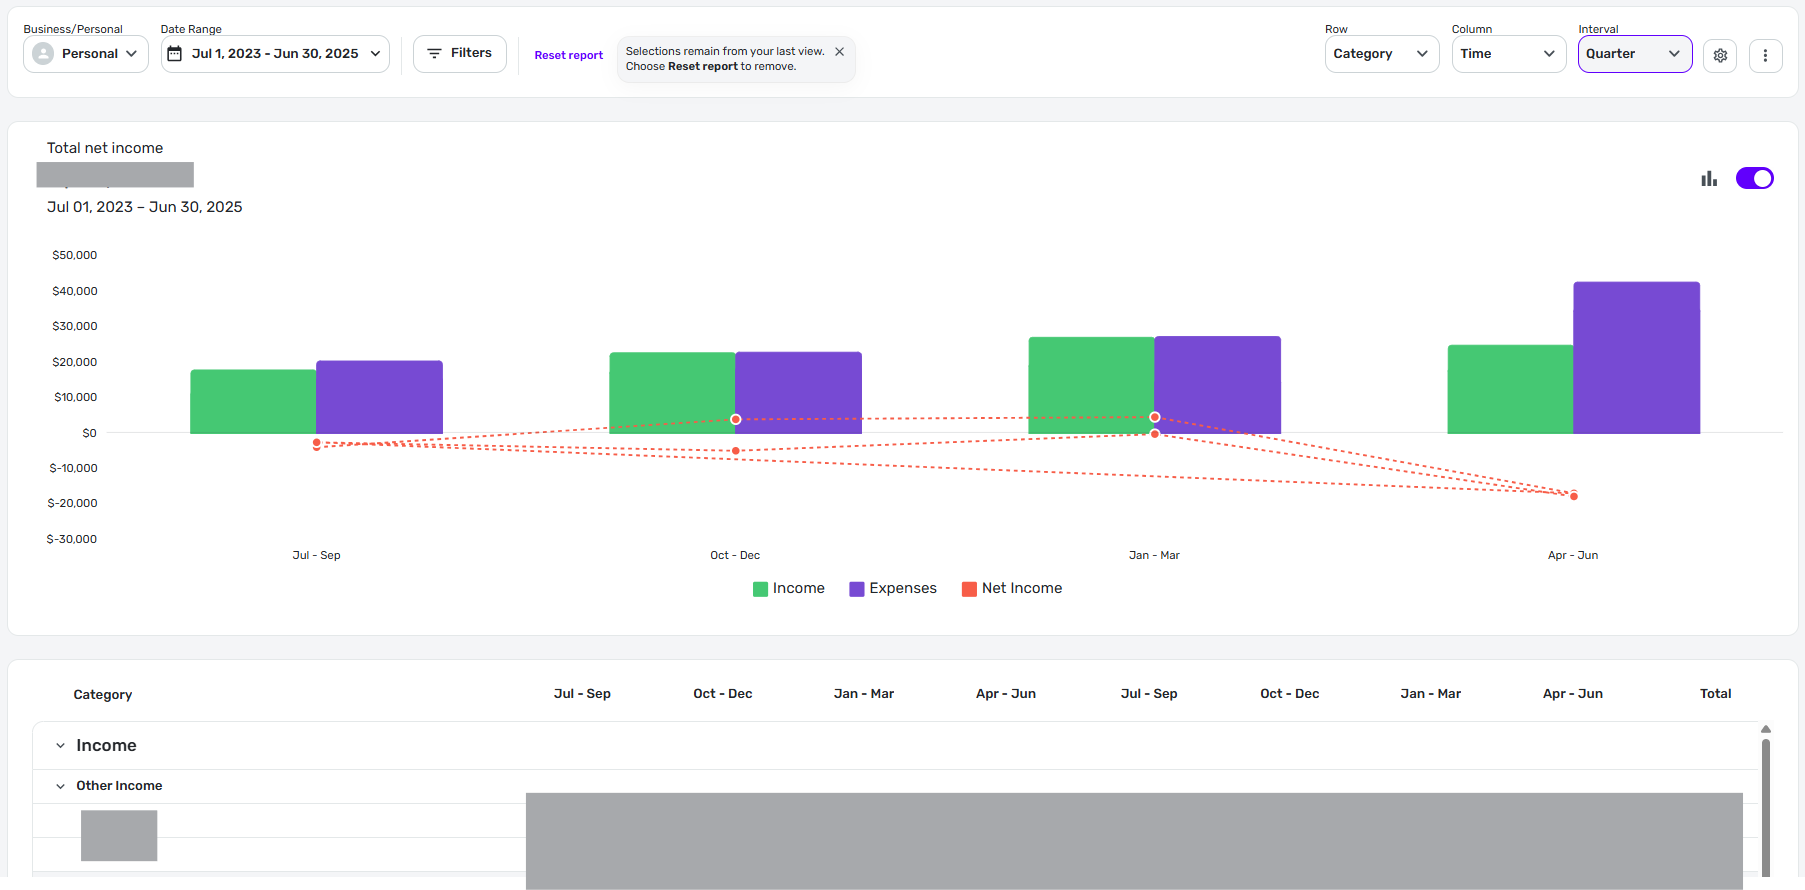
When I run a 2-year quarterly Profit & Loss report in QPB — with dates like Jul 1, 2023 to Jun 30, 2025 — there are 8 columns in the report, plus a Total column. Those columns show the results for 8 different quarters — which is exactly what I expect to see.
BUT… the bar graph at the top of the report only has 4 sets of Income & Expense bars, like this:
The numbers for the bars shown correspond to the first 4 quarters in the report. There is no way to scroll to see the the bars corresponding to the last 4 quarters in the report. They just aren't there.
- Chrome web app, Chrome Version 139.0.7258.155 (Official Build) (64-bit)
- Windows 11 Pro 24H2 build 26100.5074
- Simplifi Version: 4.73.0 (34412/1426b17065/v119.1.0-release5)
DryHeat
-Quicken Classic (1990-2020), CountAbout (2021-2024), Simplifi (2025-…)
Comments
-
Hello @DryHeat,
Thanks for reaching out! To clarify, are you stating that the bars in the graph do not match the columns within the graph? If you can include a screenshot showing the full graph with the headers and bars included all-in-one, this would help us understand the issue better.
-Coach Jon
-Coach Jon
0 -
To clarify, are you stating that the bars in the graph do not match the columns within the graph?
It guess it depends on what you mean by "match." As I said in my original post:
— there are bars for 4 different quarters but there are columns for 8 different quarters (so in that sense there is no "match")
— the 4 existing bars correspond to the first 4 quarters (so there is a "match" to the first 4 columns)
— there are no bars for the remaining 4 quarters (so there is no "match" for the 5th through 8th columns)
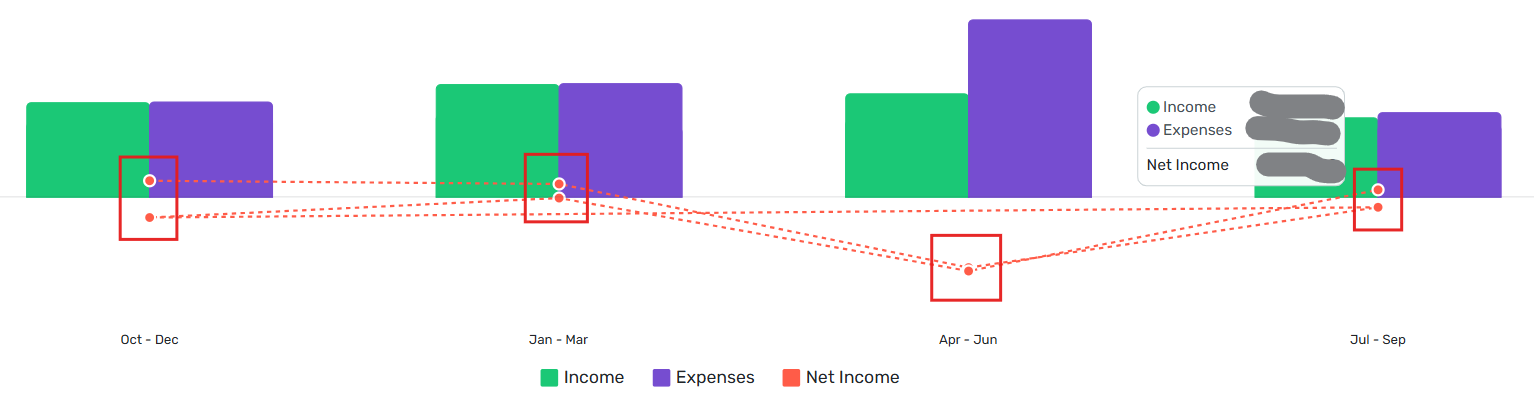
I previously provided an image of the graph showing 4 sets of bars and an image of the bars columns showing 8 quarterly columns. Below is a fresh image showing both together.
As I mentioned before, I checked the amounts of Income, Expenses, and Net Income represented by the 4 sets of bars in the graph and they correspond to the first 4 quarterly columns in the report.
Let me know if you are not able to replicate this.
DryHeat
-Quicken Classic (1990-2020), CountAbout (2021-2024), Simplifi (2025-…)0 -
Hello @DryHeat,
Thank you for clarifying further! Can you please also supply logs to better assist us with reporting this issue?
- Log into the Quicken Simplifi Web App.
- Select Profile from the left-hand navigation bar.
- With the Profile menu open, hold down the Option key for Mac or the Alt key for Windows, and then click Send Feedback.
- Leave all boxes checked, add a brief description of the issue, and then click Send.
-Coach Jon
-Coach Jon
0 -
When you ask for logs, I assume that means you cannot reproduce this on your computer and so you are wondering why it is happening on mine.
Is that correct? You can't reproduce this?
Anyway, the logs are sent — "report created - reference id 501692761184425728"
DryHeat
-Quicken Classic (1990-2020), CountAbout (2021-2024), Simplifi (2025-…)0 -
I'm seeing the same thing… sort of.
I end up with 5 quarterly bar charts. The first 4 bar graphs correspond to the first 4 quarters in the data pane. The fifth bar corresponds to the last partial quarter and there are no bar charts for the last quarter of 2024 and the first 2 quarters of 2025.
logs sent:
report created - reference id 501706905635804928
Danny
Simplifi user since 01/22
”Budget: a mathematical confirmation of your suspicions.” ~A.A. Latimer0 -
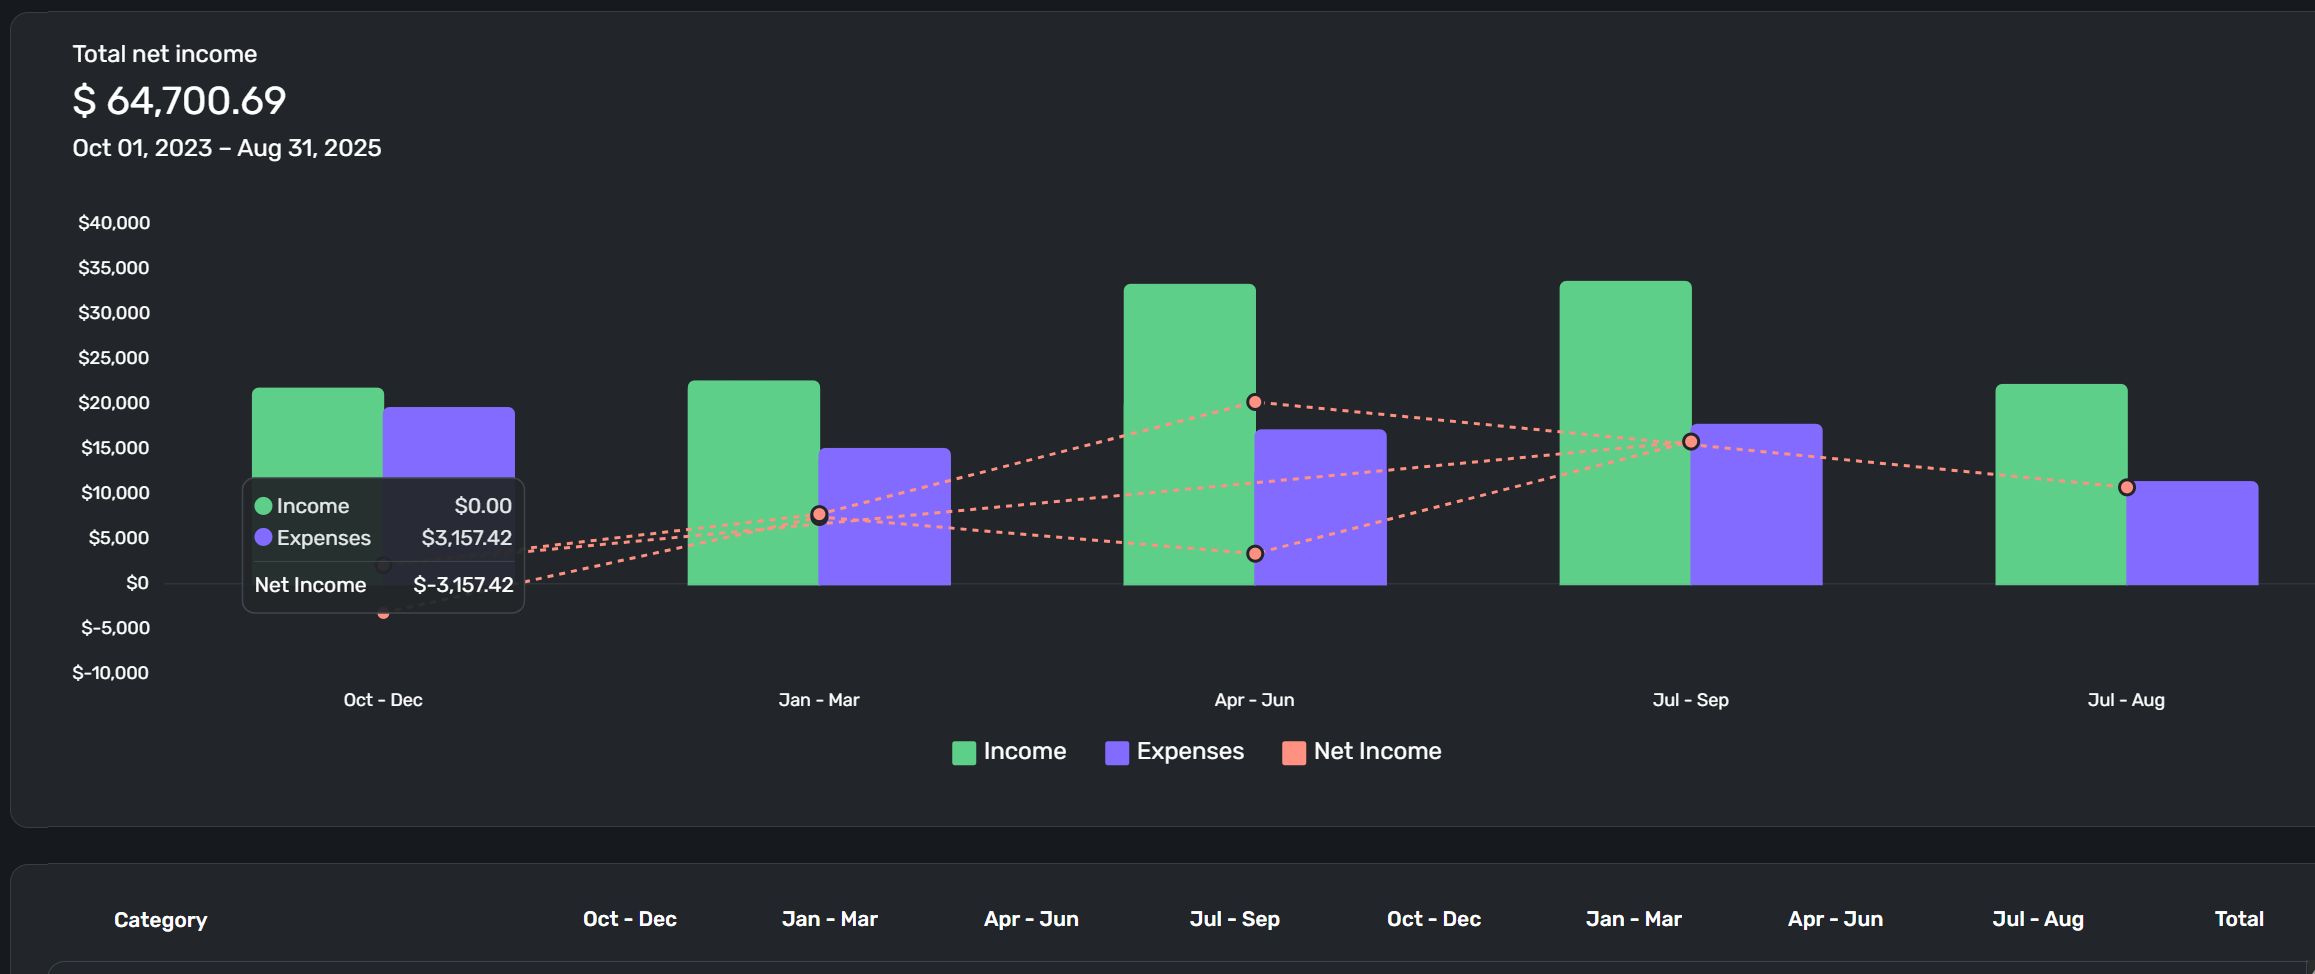
I see the same thing you do when I use the dates you used in the Profit & Loss report. There are bar graphs for the first 4 quarters and for the 8th (partial) quarter (5 bar graphs in all). There are no bar graphs for the 5th, 6th, and 7th quarters.
But when I set the dates for full quarters only (no partial quarters), I get only 4 bar graphs matching the first 4 quarters. This happens whether I set the dates for 5, 6, 7, or 8 full quarters. In all cases I get only 4 bar graphs.
The situation with a monthly report is similar. When I set the dates for 14 full months (for example), I see 14 monthly columns but only 12 monthly bar graphs. These bars correspond to the numbers in the first 12 monthly columns. The 13th and 14th months show up in the columns but don't show up in the bar graph.
UPDATE: I was wondering if there was some limit on the number of bars that could be shown. So I selected a 59 day period (Jan 1 to Feb 28) and set the interval for "Day." The bar graph portion of the report shows 59 pairs of bars, one for each day. So it should have the ability to show bars for 8 quarters or 14 months — but it doesn't do that.
DryHeat
-Quicken Classic (1990-2020), CountAbout (2021-2024), Simplifi (2025-…)0 -
Thanks, @Coach Jon
I don't pay any attention to quarterly results in my personal finances, but I do want QS to function at the highest level of performance possible. Perfection? Ain't going to happen but finding and fixing these little details is important. Thanks for moving this forward.
Danny
Simplifi user since 01/22
”Budget: a mathematical confirmation of your suspicions.” ~A.A. Latimer1 -
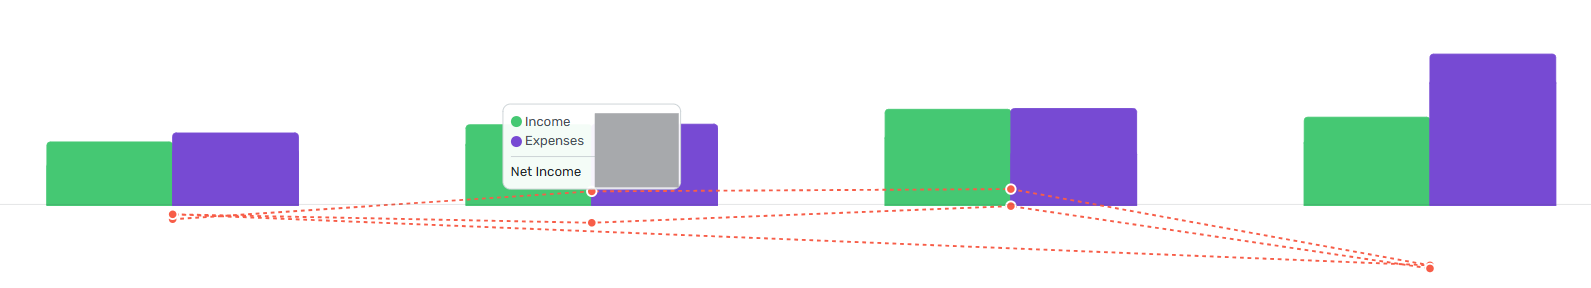
I tried again to generate an 8-quarter Income & Expense report. As before, I only got 4 sets of bars appearing to represent 4 quarters.
BUT… I noticed that the overlaid line graph representing Net Income appears to have 8 points on it — with two points appearing under each set of bars. (The actual numbers in the report make no sense because I only started using Simplifi this year and only partial data was imported for 2023 and 2024, but you can see how this works.)
DryHeat
-Quicken Classic (1990-2020), CountAbout (2021-2024), Simplifi (2025-…)0 -
Hello @DryHeat,
With the Enhanced Reports currently in Early Access, the issue reported here seems to be obsolete. I tested this on my end and was no longer able to reproduce the issue. Please enable Early Access and let us know if you're still seeing this issue after doing so. I want to confirm before closing the ticket as obsolete.
Thank you!
-Coach Jon
0 -
I think it's fixed. A two-year quarterly P&L report now shows a graph with 8 quarters represented.
DryHeat
-Quicken Classic (1990-2020), CountAbout (2021-2024), Simplifi (2025-…)1