Mobile App: Income & Expense Report: Add a grand total for each category for the timeframe selected

Love the income and expense report that is like a P&L statement. One additional view on mobile that would be very helpful is a YTD view (in addition to a view of each month as an individual period). I’d love to have a quick view of all my income and expenses by category year to date.
[edited title]
Comments
-
I think I know what you mean but I will point out that the report is YTD but displays in months. On the web app you can choose the interval to be year instead of months. But apparently not the phone app.
One workaround is to use the Spending Report YTD, which will show you categories for the entire year both as a pie chart and amounts per category. It won't show you the Income, but you can see that in the Income Report.
Steve
Quicken Simplifi (Safari & iOS) Since 2021
Quicken Classic (MacOS) Since 2009
MS Money (1991-2009) and Dollars & Sense (1987-1991)0 -
@ChefKeith, thank you for posting your suggestion to the Community!
I have moved this out of Feature Requests for now, as it looks like the Income & Expense Report on the Quicken Simplifi Mobile App already has a YTD option —
With that, are you looking for what @SRC54 mentioned, where you'd like to be able to change the Interval as the Quicken Simplifi Web App allows? If so, I think we can definitely turn this back into a Feature Request requesting that Interval options be added to Reports on the Mobile App.
Let us know!
-Coach Natalie
1 -
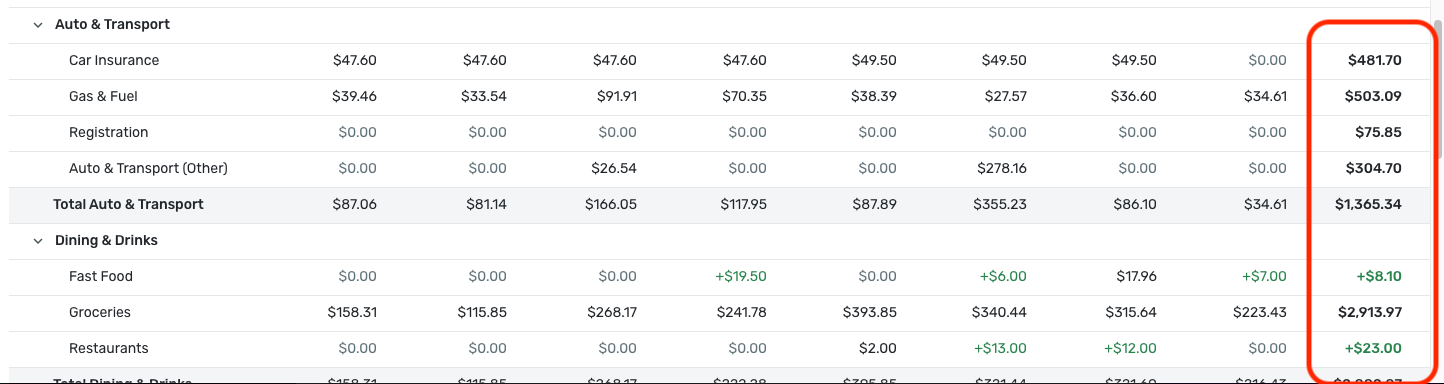
What I'm looking for is available on the web app but not on the mobile (at least that I can see). On the web app, the income and expense report can be set for YTD and it shows each monthly period as one column but then has a Total column that totals up for YTD. The Spending Report that @SRC54 mentions is more summarized (at least on the mobile app). It will show the top several categories but then has an "Everything else" that it lumps everything else into. And it also lumps subcategories into the main category without a way to see a breakdown of amounts in the subcategories. In summary, I'd like to see a "Total" option in the mobile app for the Income & Expense report that shows the total of each category YTD just like the web app does. Hopefully that all makes sense. Thanks for listening and making improvements!
0 -
@ChefKeith, thanks for the reply!
I apologize for the confusion — when referring to what SRC54 mentioned, I meant having Interval options like the Web App allows, not using the Spending Report:
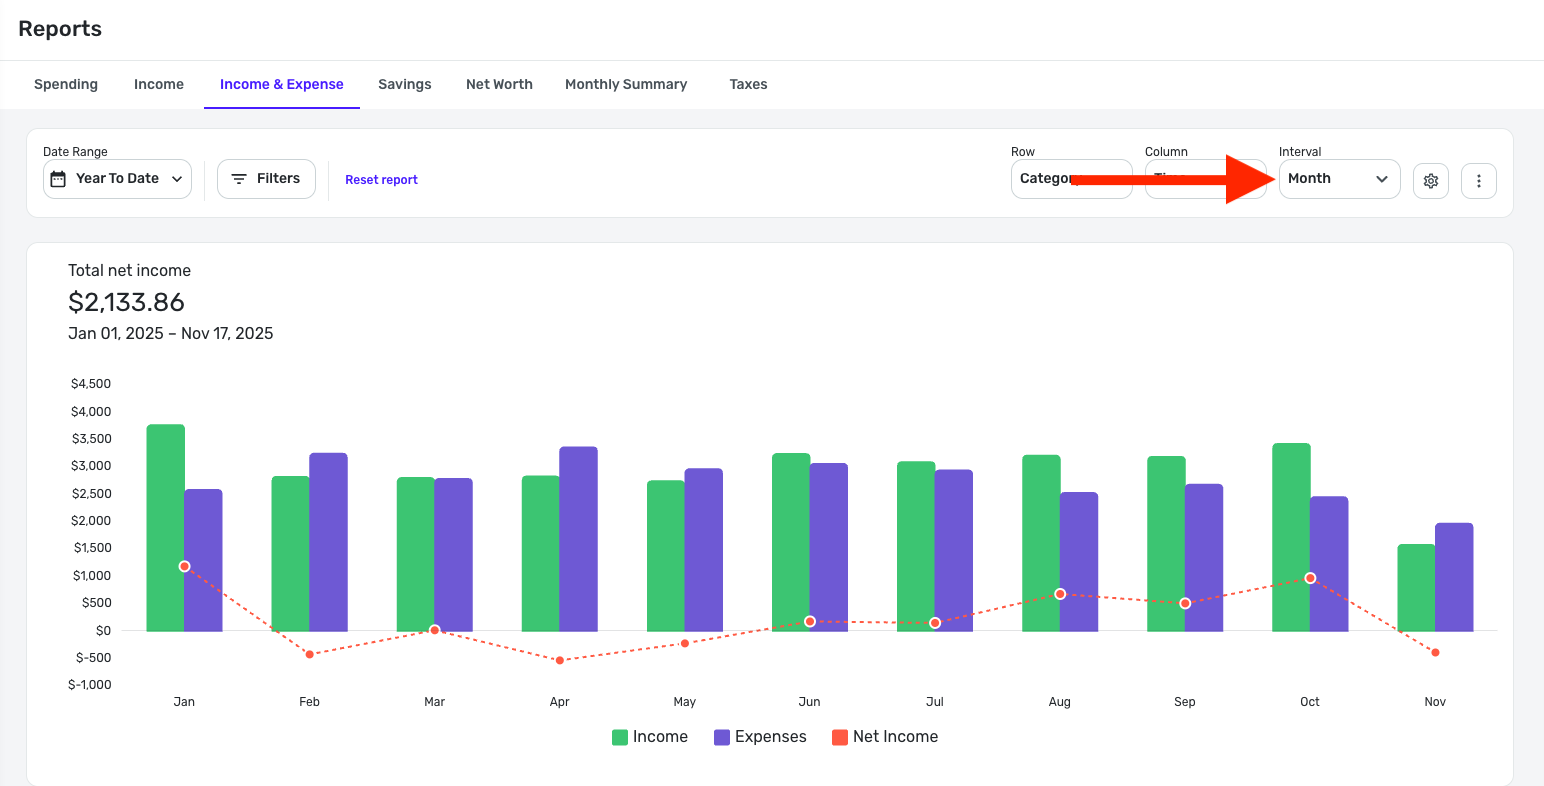
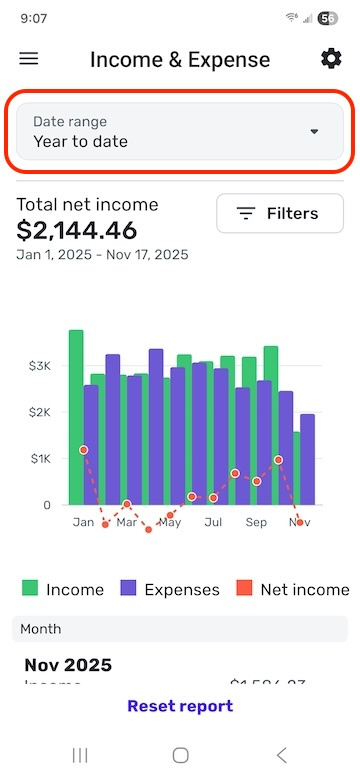
Otherwise, I'm afraid I'm not seeing any differences between the Web and Mobile Apps when using the Income & Expense Report. Both have a graph that shows Income, Expenses, and Net Income, with a 'Total net income' at the top. I can scroll down on both to see the totals for each individual month. On the Mobile App, I can click into a month to see the category drilldown, which the Web App shows on the main screen. I can click into any of the categories in both locations to view and edit the transactions.
I guess there is one difference I'm seeing — the Web App has the grand total for each category for the time period selected, and I'm not seeing this on the Mobile App anywhere. Is this the "Total" you're referring to?
Let us know!
-Coach Natalie
1 -
Yes, I think what you want is to have the interval yearly, which is not available right now on the phone app. My suggestion for using the Spending Report was just a workaround for now.
If you want to see a yearly interval in the Year to Date Report, let @Coach Natalie know, and I think she will alter your suggestion slightly and activate it for us to upvote it. I will be glad to vote for it. 😀
Steve
Quicken Simplifi (Safari & iOS) Since 2021
Quicken Classic (MacOS) Since 2009
MS Money (1991-2009) and Dollars & Sense (1987-1991)0 -
@Coach Natalie - Your last paragraph captures what I'm requesting for the mobile app — I'd like to see a Grand Total for each category for the time period selected i.e. if I choose YTD for the period and we're in the month of November, I'd like to see a column that sums up all the inflows/outflows in each category & subcategory January - November. I prefer managing my money from an annual perspective and there's no other ready-made report in the mobile app (that I've found at least) that provides a detailed view of the inflow/outflow from all my categories and subcategories YTD. Thanks!
0 -
@ChefKeith, thank you for confirming!
I have turned this back into a Feature Request, and have edited it to be more specific to the request, as well as to be more general for other date range options. 🙂
-Coach Natalie
0

