Planned Spending "Last Six Months" Average is overinflated (edited)
Still continuing to identify this issue. Current work around is to use watchlists in another tab.
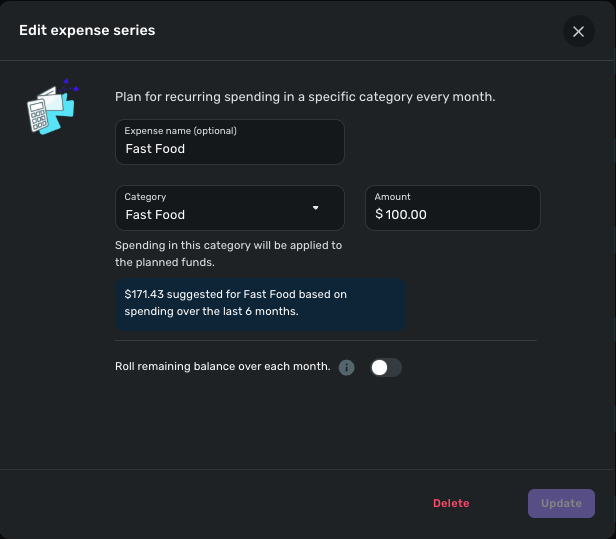
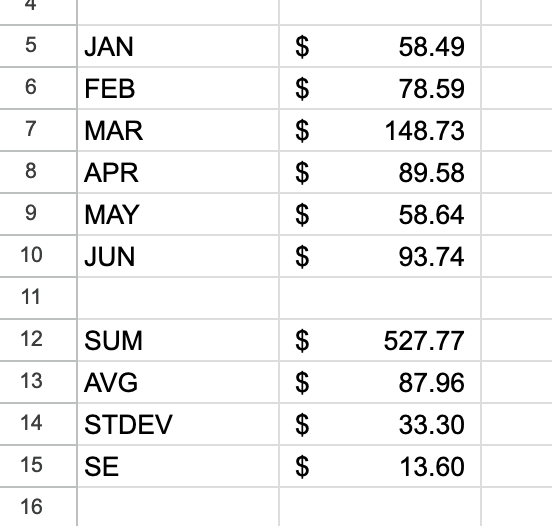
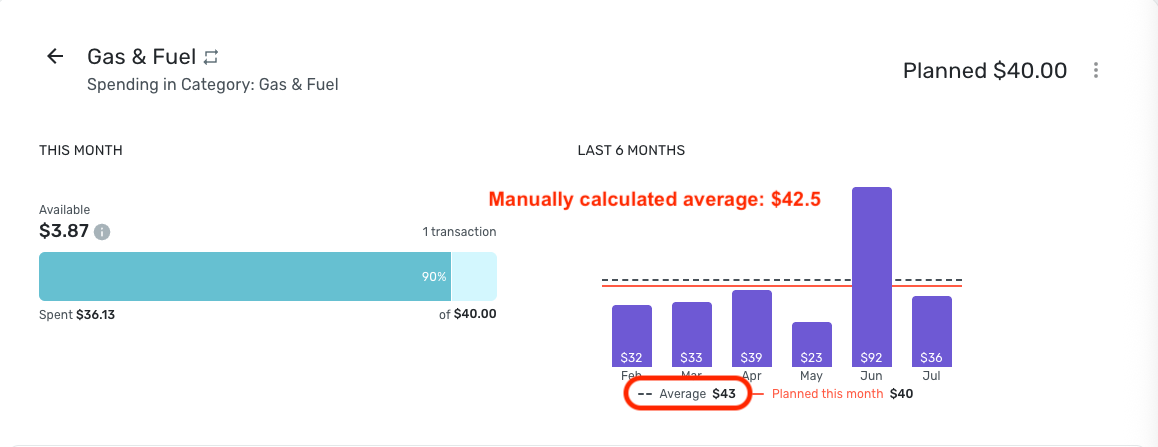
Obviously $171 ≠ $88.
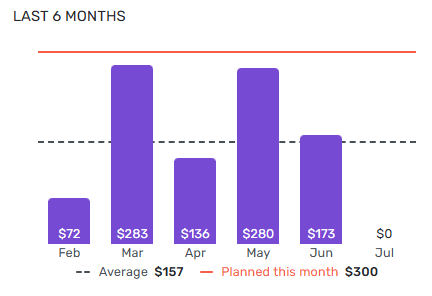
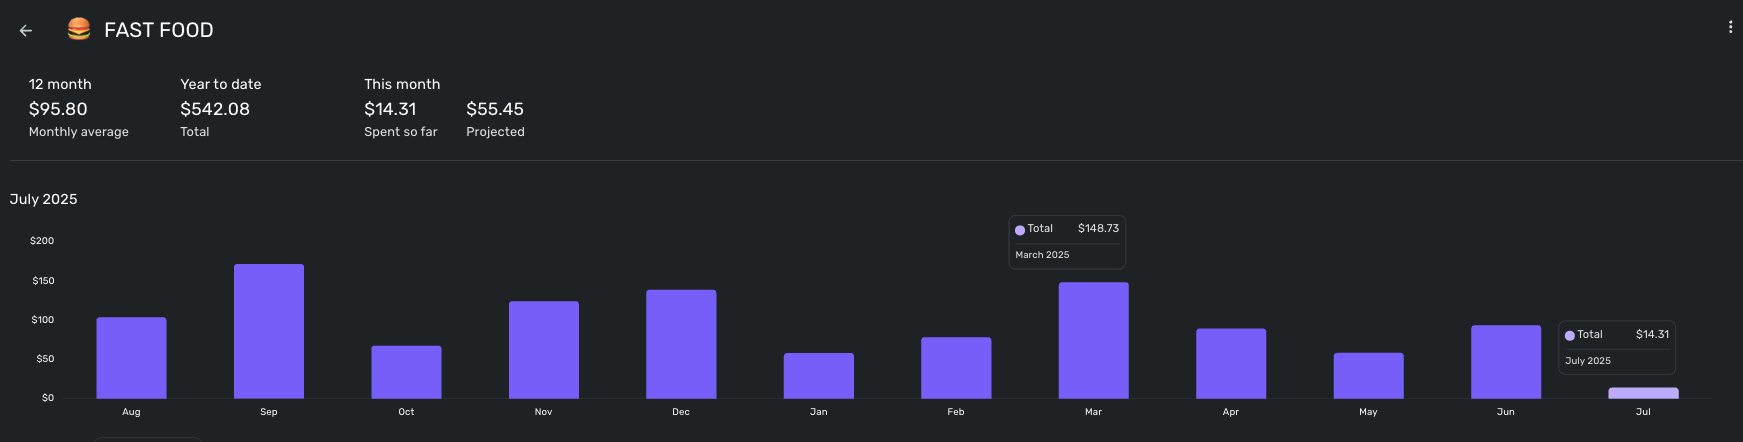
For reference that is a watchlist on the "Fast Food" Category. This isn't a one off either- it effect all projections within Spending Plans…. Any chance of a fix? :)
Comments
-
@Strigolactone, thanks for reaching out to the Community with this issue!
To clarify, we would need to look at Planned Spending itself to best determine that the average spending "suggested" amount is incorrect. I tested this in a Planned Spending expense of my own by viewing the 6-month chart, and the average displayed in the chart. I then deleted and recreated the expense to see what the "suggested" amount was, and it did not match —
Does this seem to align with what you're seeing as well? Let us know!
-Coach Natalie
0 -
Your manually-calculated monthly average (based on the numbers in your graph) may be being thrown off by the inclusion of the partial month of July.
It's possible that Simplifi is calculating the average based on January-June instead of February-July in order to average only full months. (You would have look at January's fuel cost to be sure.)
DryHeat
-Quicken Classic (1990-2020), CountAbout (2021-2024), Simplifi (2025-…)0 -
@DryHeat, definitely a good idea to look at!
Including January instead of July got me closer — $47.50 as the average. Still not the $49.17 Planned Spending is showing for the average spending "suggested" amount.
-Coach Natalie
0 -
Actually, I noticed that @Strigolactone is using the new Spending Plan design. When I checked my dataset that has the new design, I see $47.50, which matches my average spending from January - June.
It seems that the current month may be excluded from this calculation when creating a Planned Spending expense.
-Coach Natalie
0 -
"It seems that the current month may be excluded from this calculation when creating a Planned Spending expense."
That's an improvement. The inclusion of a partial month makes the previous averaging method misleading. In the sample below, my average per month over the previous 5 months is actually $188, not $157.
Does the new version also change the "LAST 6 MONTHS" graph on the planned spending item to actually use the last 6 full months? (In other words, would the graph above now show Jan-June instead of Feb-July?)
DryHeat
-Quicken Classic (1990-2020), CountAbout (2021-2024), Simplifi (2025-…)0 -
@DryHeat, the graph still shows the current month included —
Which means that this Idea post is likely still valid with the new design:
-Coach Natalie
1 -
I came back to see if my post generated any comments and boy howdy it did!
I still struggle with that- even if (or if it’s not) including a partial, current month- my average within spending plan is excessively higher than my actual data supports. To me- this indicates a tabulation issues.
This occurs on almost every category I track- to the point I have creating dozens of watch lists to accurately calculate my averages for month-to-month adjustments. But that’s comparing six months to twelve…
It works for now, but it still has me scratching my head as to what and why this could be happening.0 -
@Strigolactone, do you want to provide more detailed information so we can take a closer look? Seeing your specific spending in that category for each month (January - July) would be a good start. Maybe some additional examples with details as well, since it sounds to be a common issue within Planned Spending for you.
Thanks!
-Coach Natalie
0 -
"it still has me scratching my head as to what and why this could be happening."
Simplifi seems to have its own idiosyncratic idea of what constitutes the "last 6 months" — namely, that it includes the previous 5 months plus whatever days have passed in the month we are currently in.
This idiosyncrasy also shows up in Reports, where selecting the date range "Last 6 Months" today will get you February through June plus the first 10 days in July.
There have been requests to change the date selection in Reports, and maybe if they fix it there they will fix it here too.
DryHeat
-Quicken Classic (1990-2020), CountAbout (2021-2024), Simplifi (2025-…)1 -
This has always been a complaint. Simplifi should only count full months when choosing last quarter, last 6 months, etc. whether in spending plan or reports.
The exceptions I would make is "This Year," "This Month" when you would expect the recent data.
Steve
Quicken Simplifi (Safari & iOS) Since 2021
Quicken Classic (MacOS) Since 2009
MS Money (1991-2009) and Dollars & Sense (1987-1991)0 -
Happy to- but that is what we are seeing in my screenshots. July at the time of posting this would have been $36.
The reason I struggle is- no matter how I tabulate my category averages… It doesn't equal $171.43.
This is regardless of including July or not. Let me know what you want and I can grab it for you! :)0 -
@Strigolactone, thanks for the reply!
We'd want to see the spending for each month (January - July) from within Quicken Simplifi. It may be easiest to pull a Spending Report with a custom date range and then hover over each month in the graph to see the totals, but you could also do the hover in each month from a Watchlist. Providing visuals from within the program will allow the Community to see the full picture.
Much appreciated!
-Coach Natalie
0


