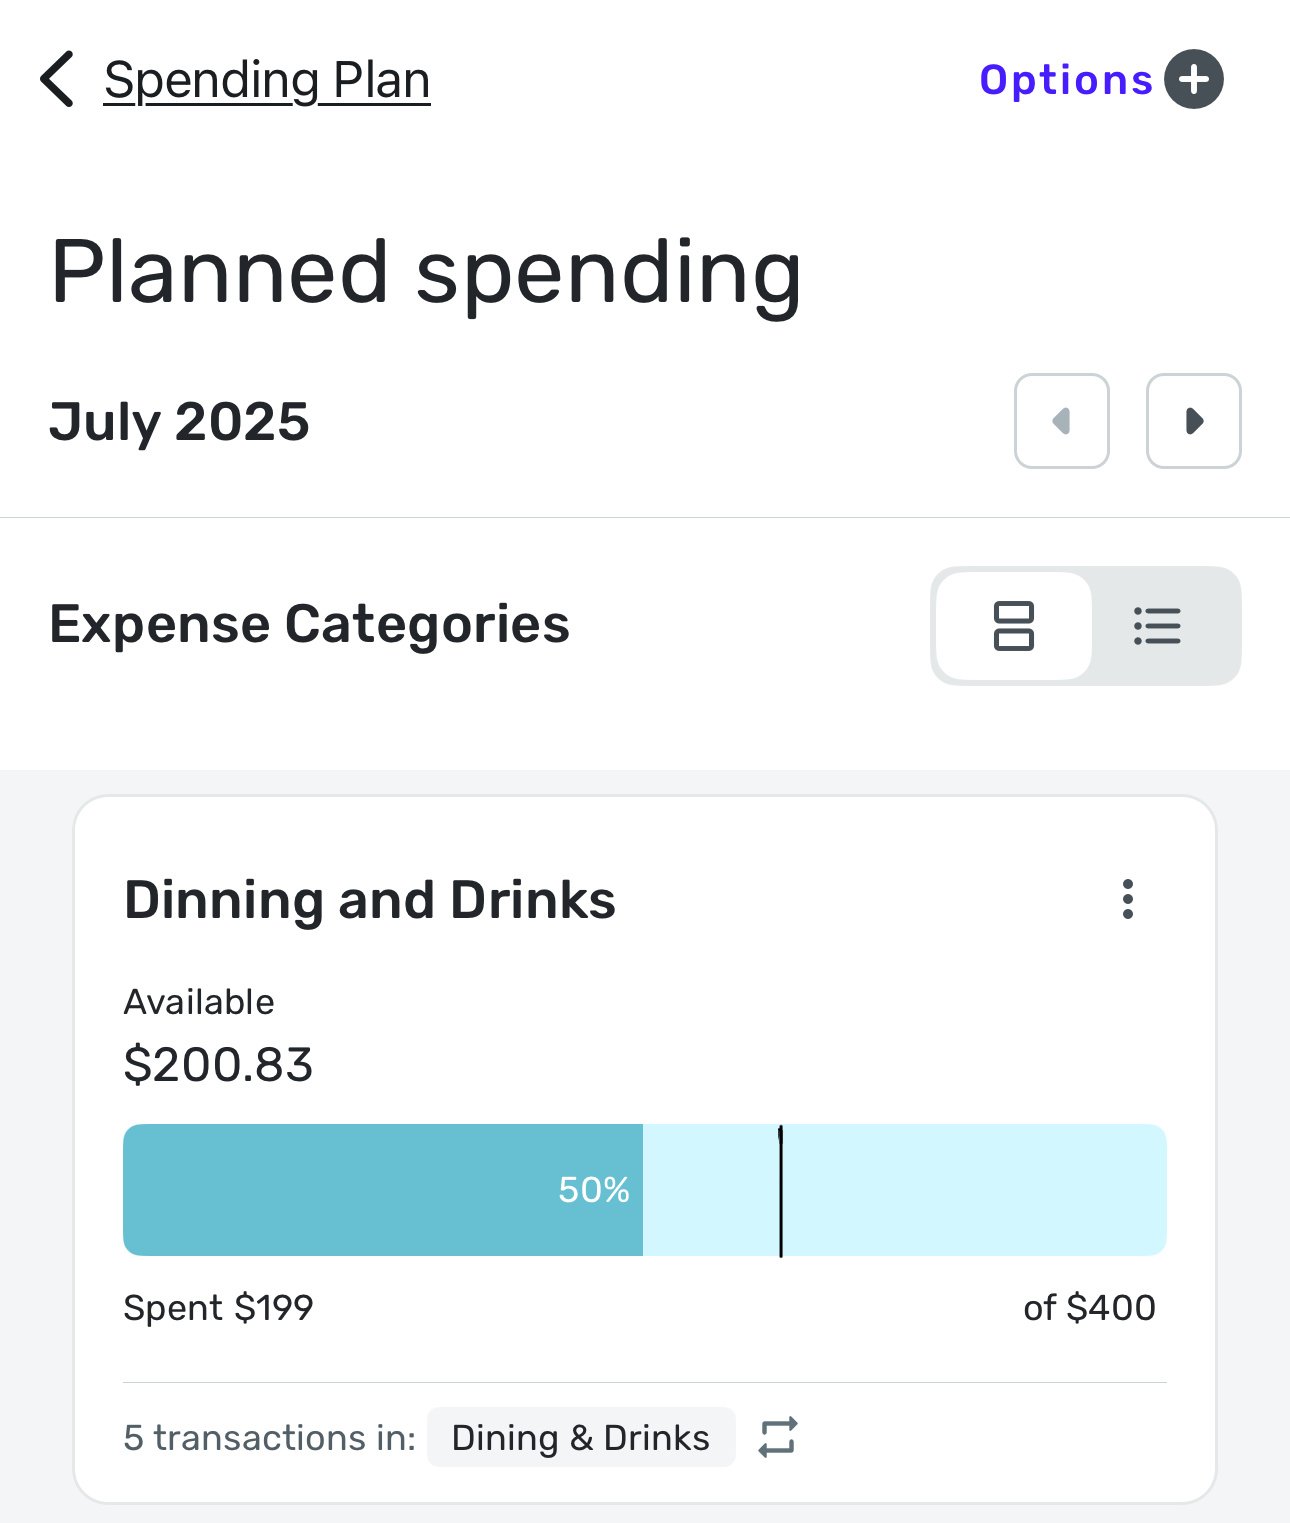
Would like a simple feature added to the planned spending graphs to show the percent of days remaining in the current month. This would serve as a general gauge to assess if you’re ahead or behind on spending relative to the number of days remaining in the current month.
This could be shown as a thin vertical line (or dotted line) on the existing horizontal bar that shows percent of total spent for each category.
For example: The user has $400 planned in the Shopping category and has already spent $200. The current bar graph has $200 of the total $400 shaded (50%). If today is the 20th and there are 30 days total in the month, a thin line would exist at the 66.6% mark indicating the user is behind on spending relative to the number of days remaining.