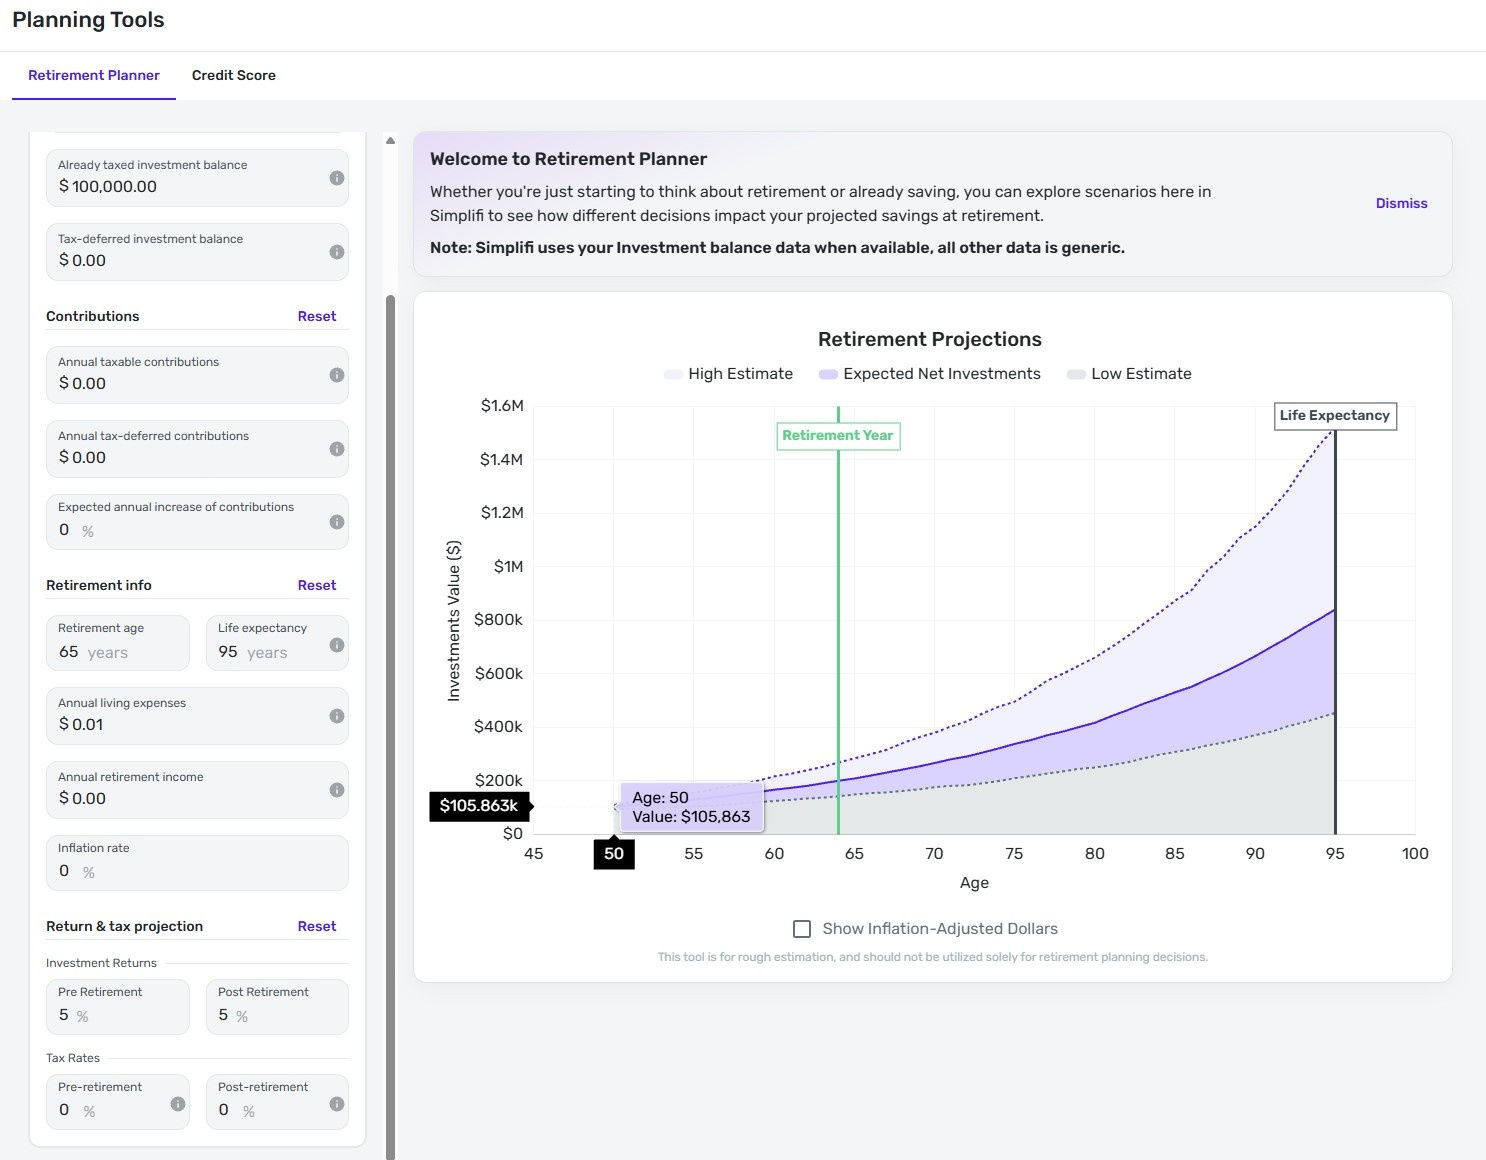
A very simple data check is to give a current investment balance, an investment return, and zero out every other parameter (in advanced mode).
First issue: The first year on the graph seems to show a year of returns. (Miscalculated, but probably supposed to be a year) Year 2 should show the first year of returns, right?
Now the data calculation test:
Example:
If I input 100,000, Age 50, 5% return. Everything else is zero'd out. The graph displays at Age 50 displays different values: 105918, 106140, 105863, etc. as I increment retirement age and life expectancy it recalculates. The one year value should not change by modifying mid and endpoint ages.
There appears to be some hidden/not disclosed volatility, but all values run high. One year return can show over 6% in the first year! (I'm not referring to the high estimate, where the basis for this range is not divulged either.)
Doing basic math, whether the return is compounded daily or yearly, the expected final investment value after 1 year should be between $105000 and 105127.
What is the explanation? Who knows if any of the other fields calculate correctly. Also notice there is no table of values available.