Spending Report Graph missing in at least some cases
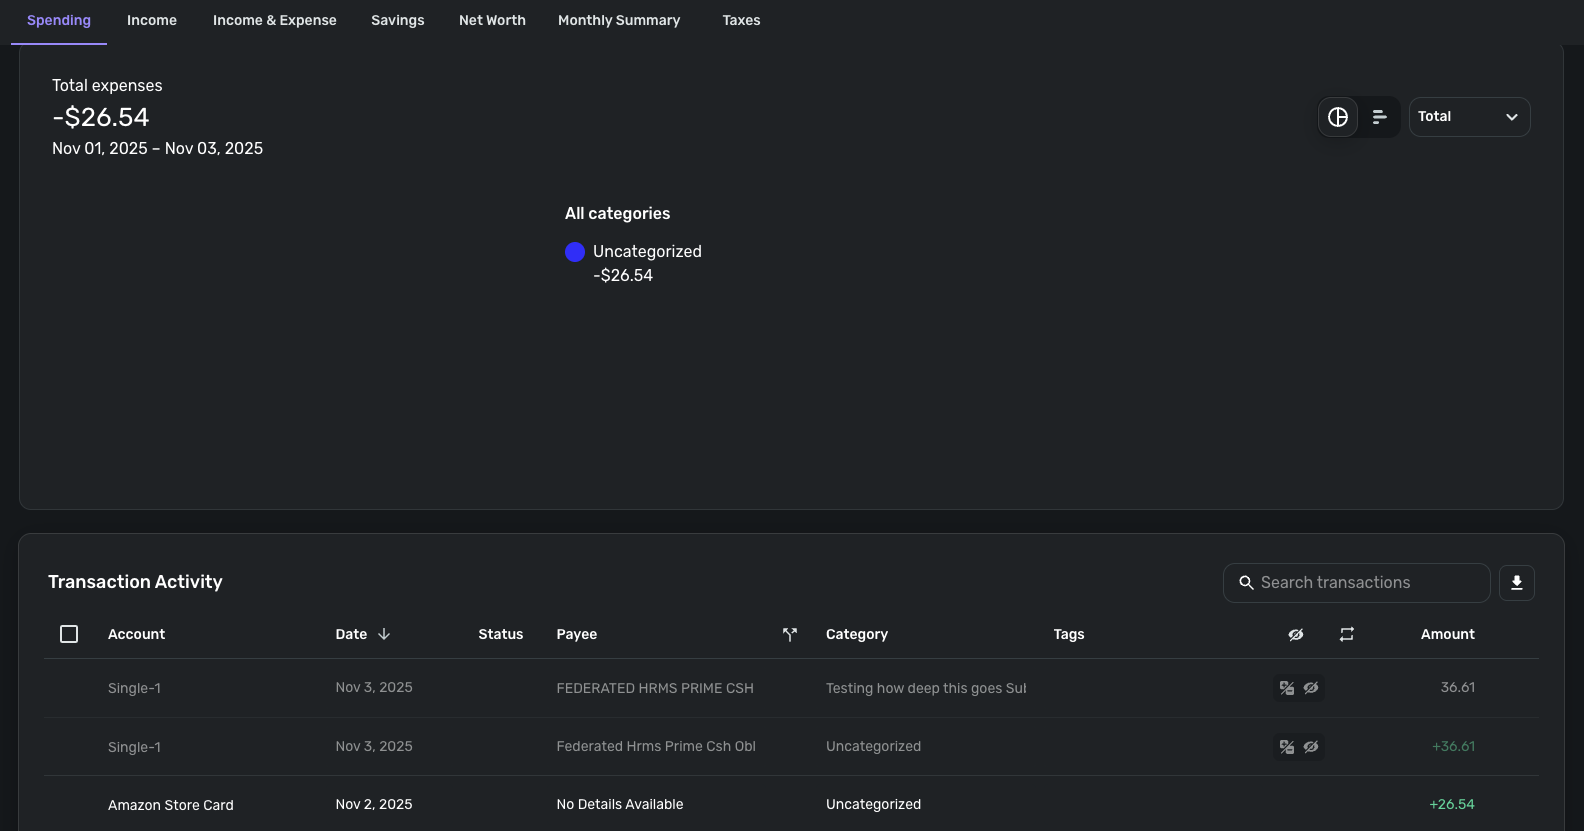
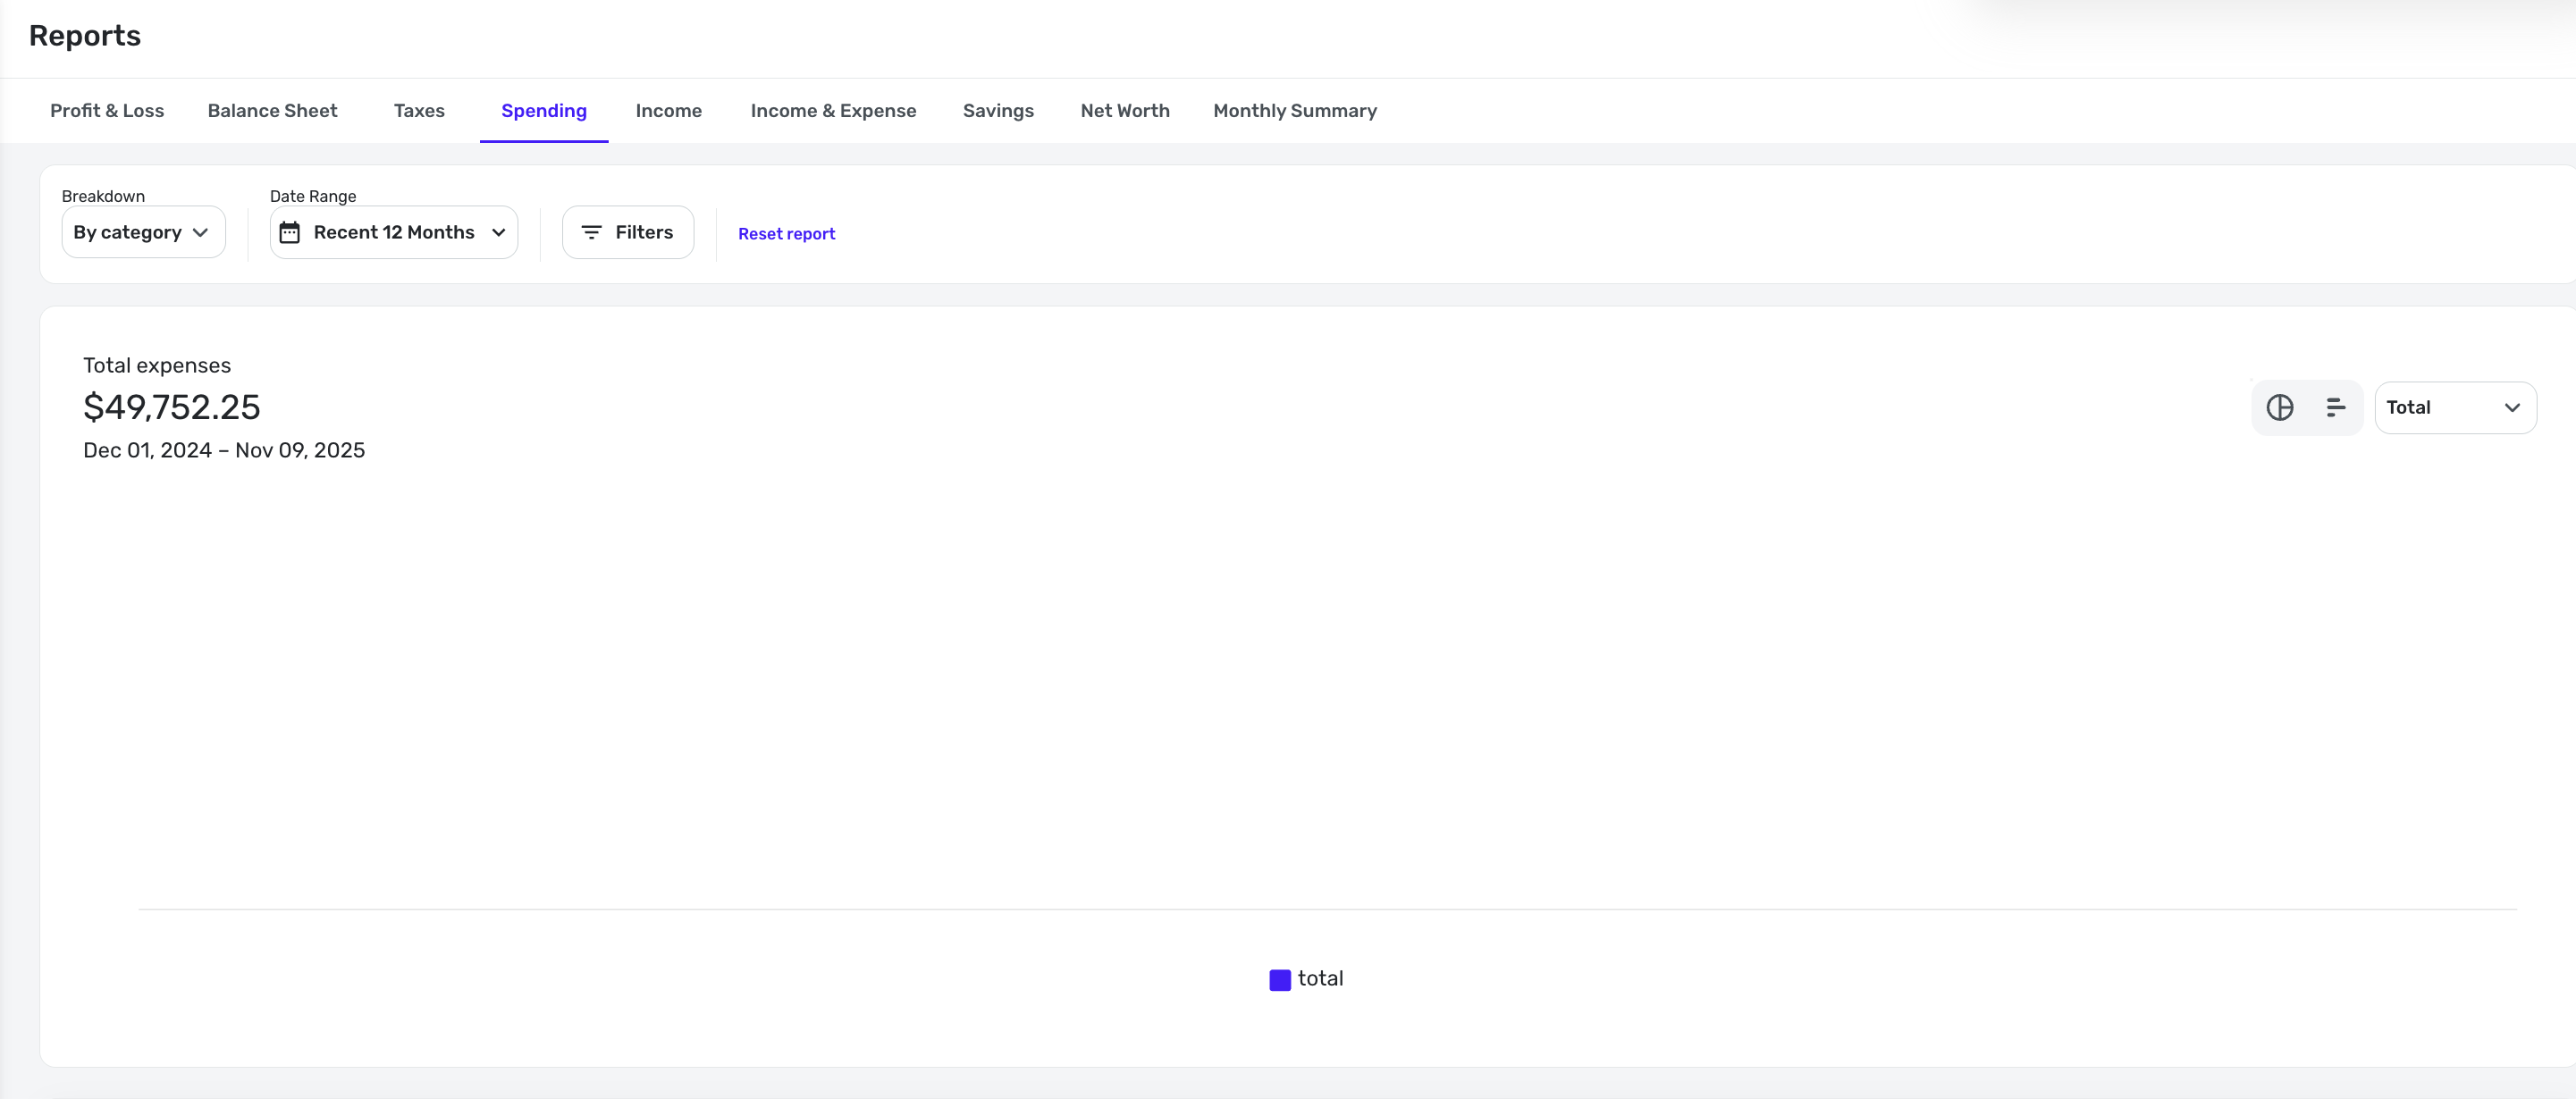
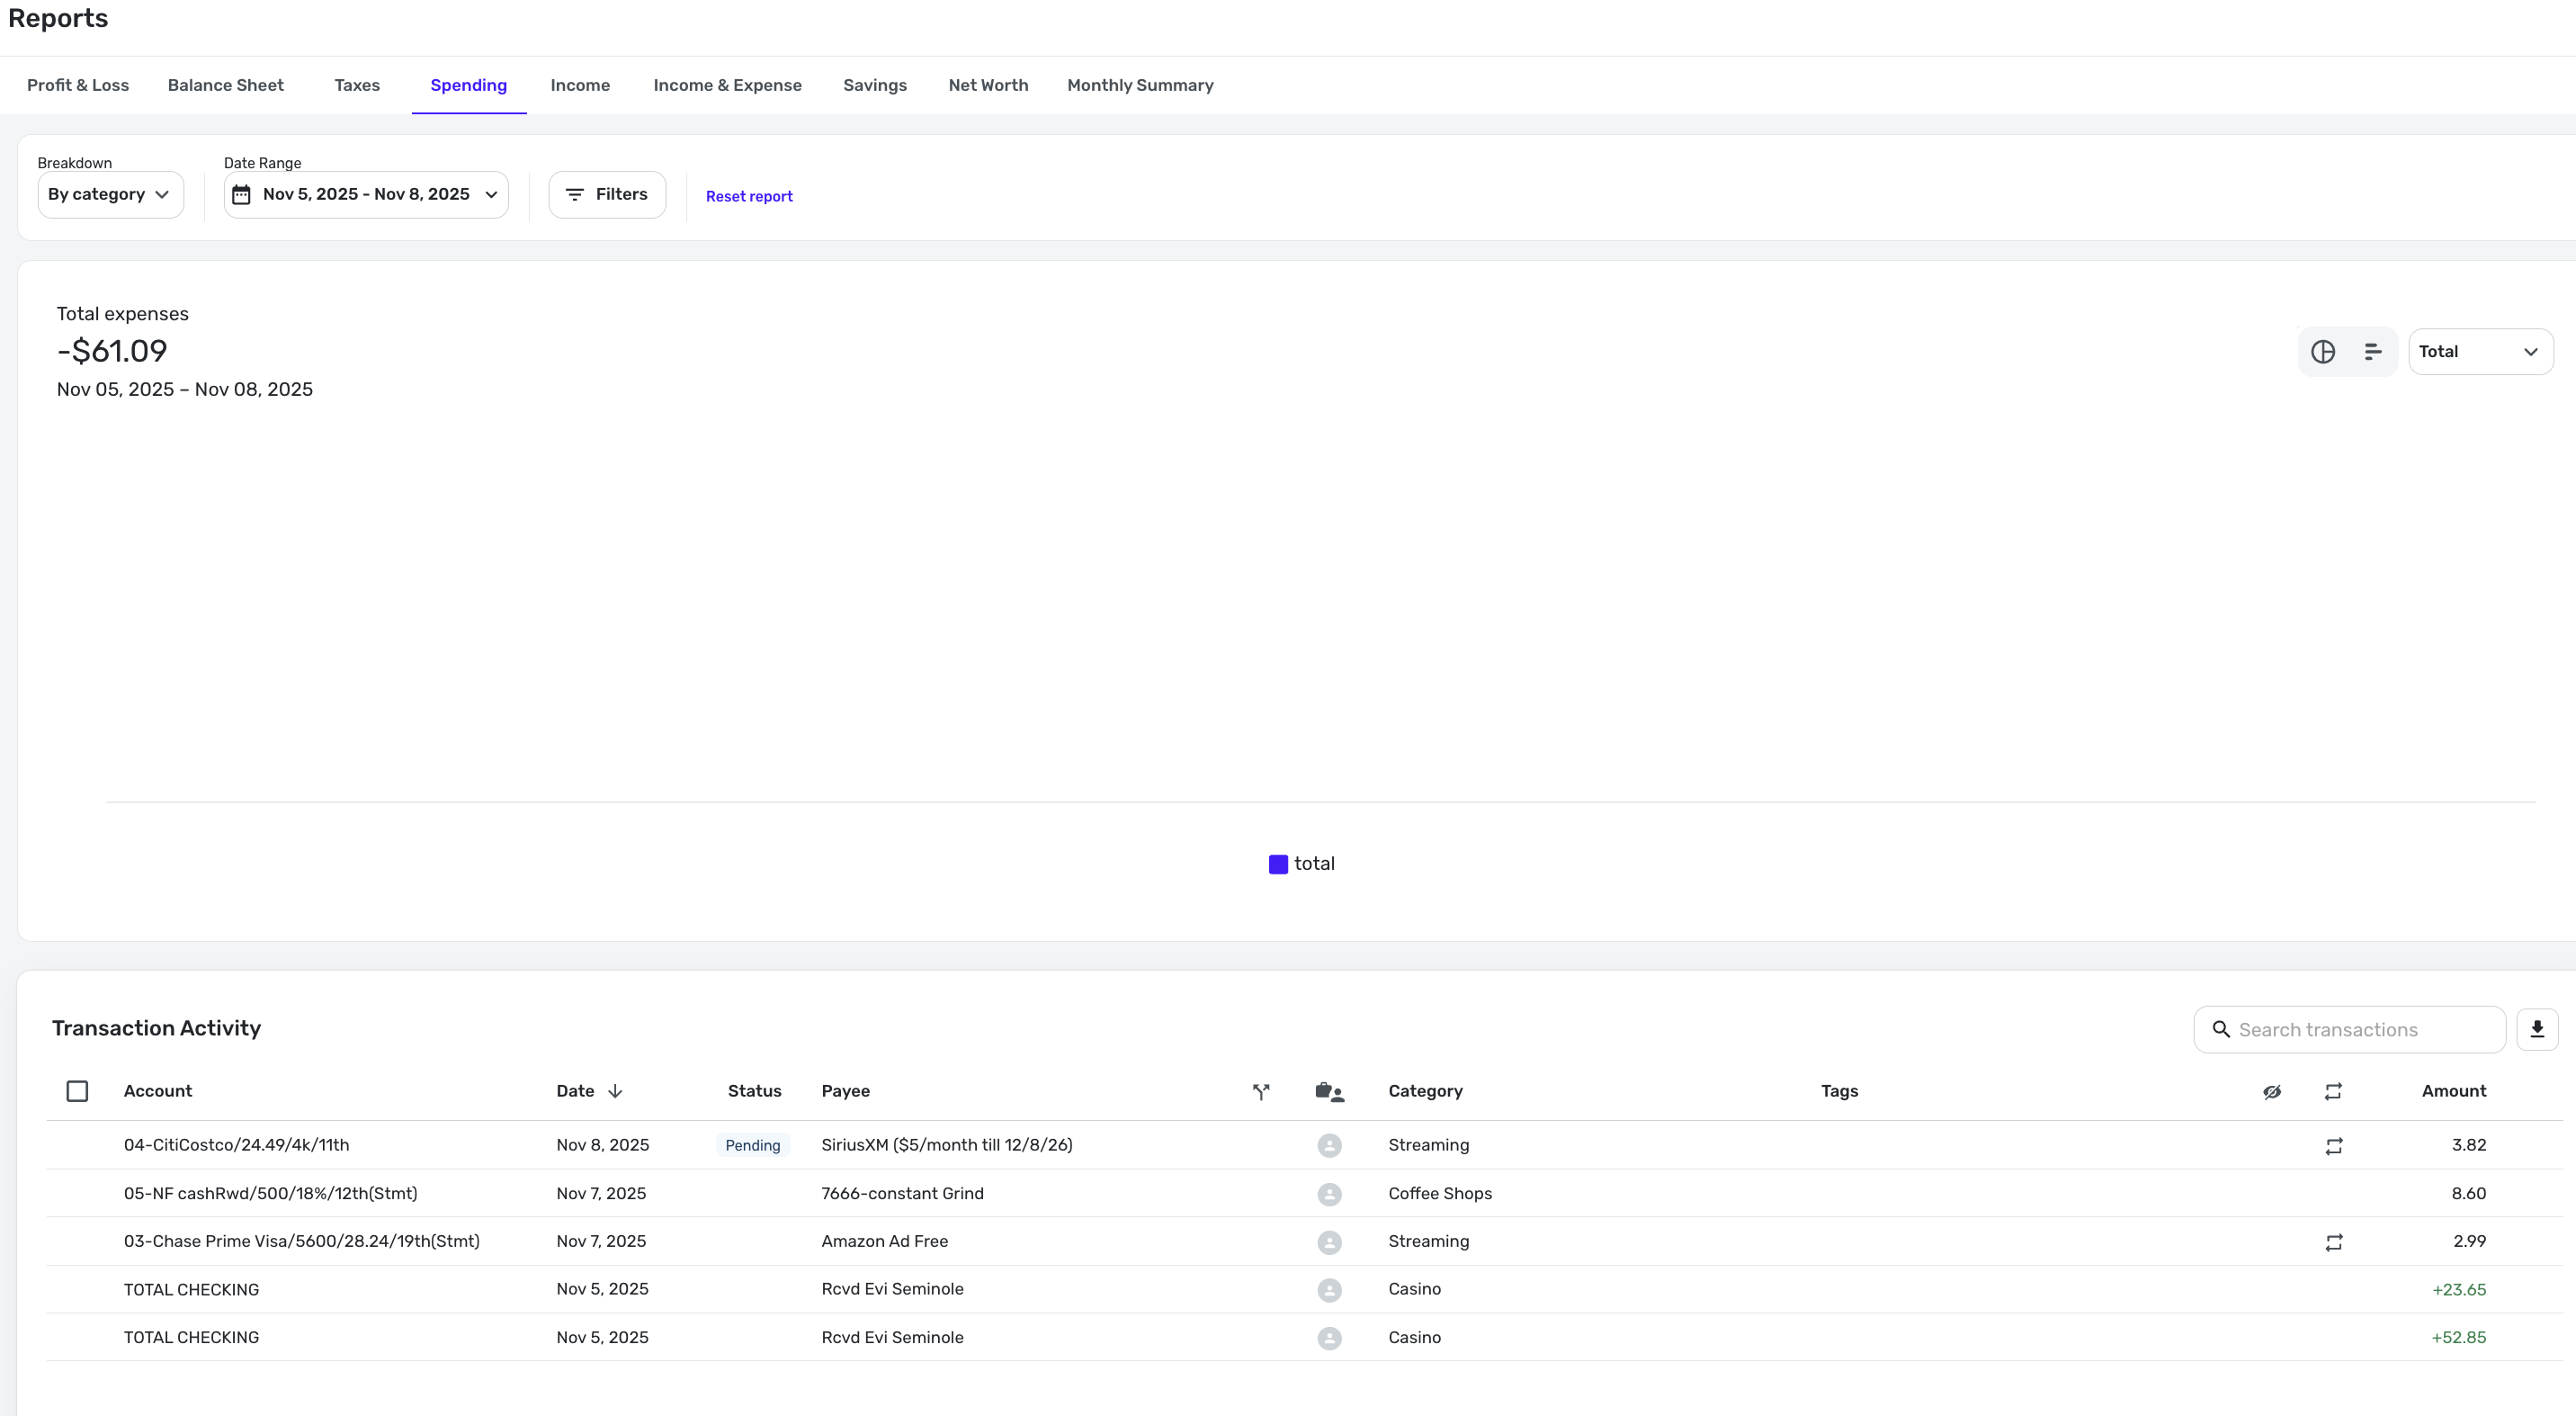
For the 4 day spending graph, Nov. 5-8, when there were 5 transactions seen at bottom (some positive, some negative), the spending chart is missing.
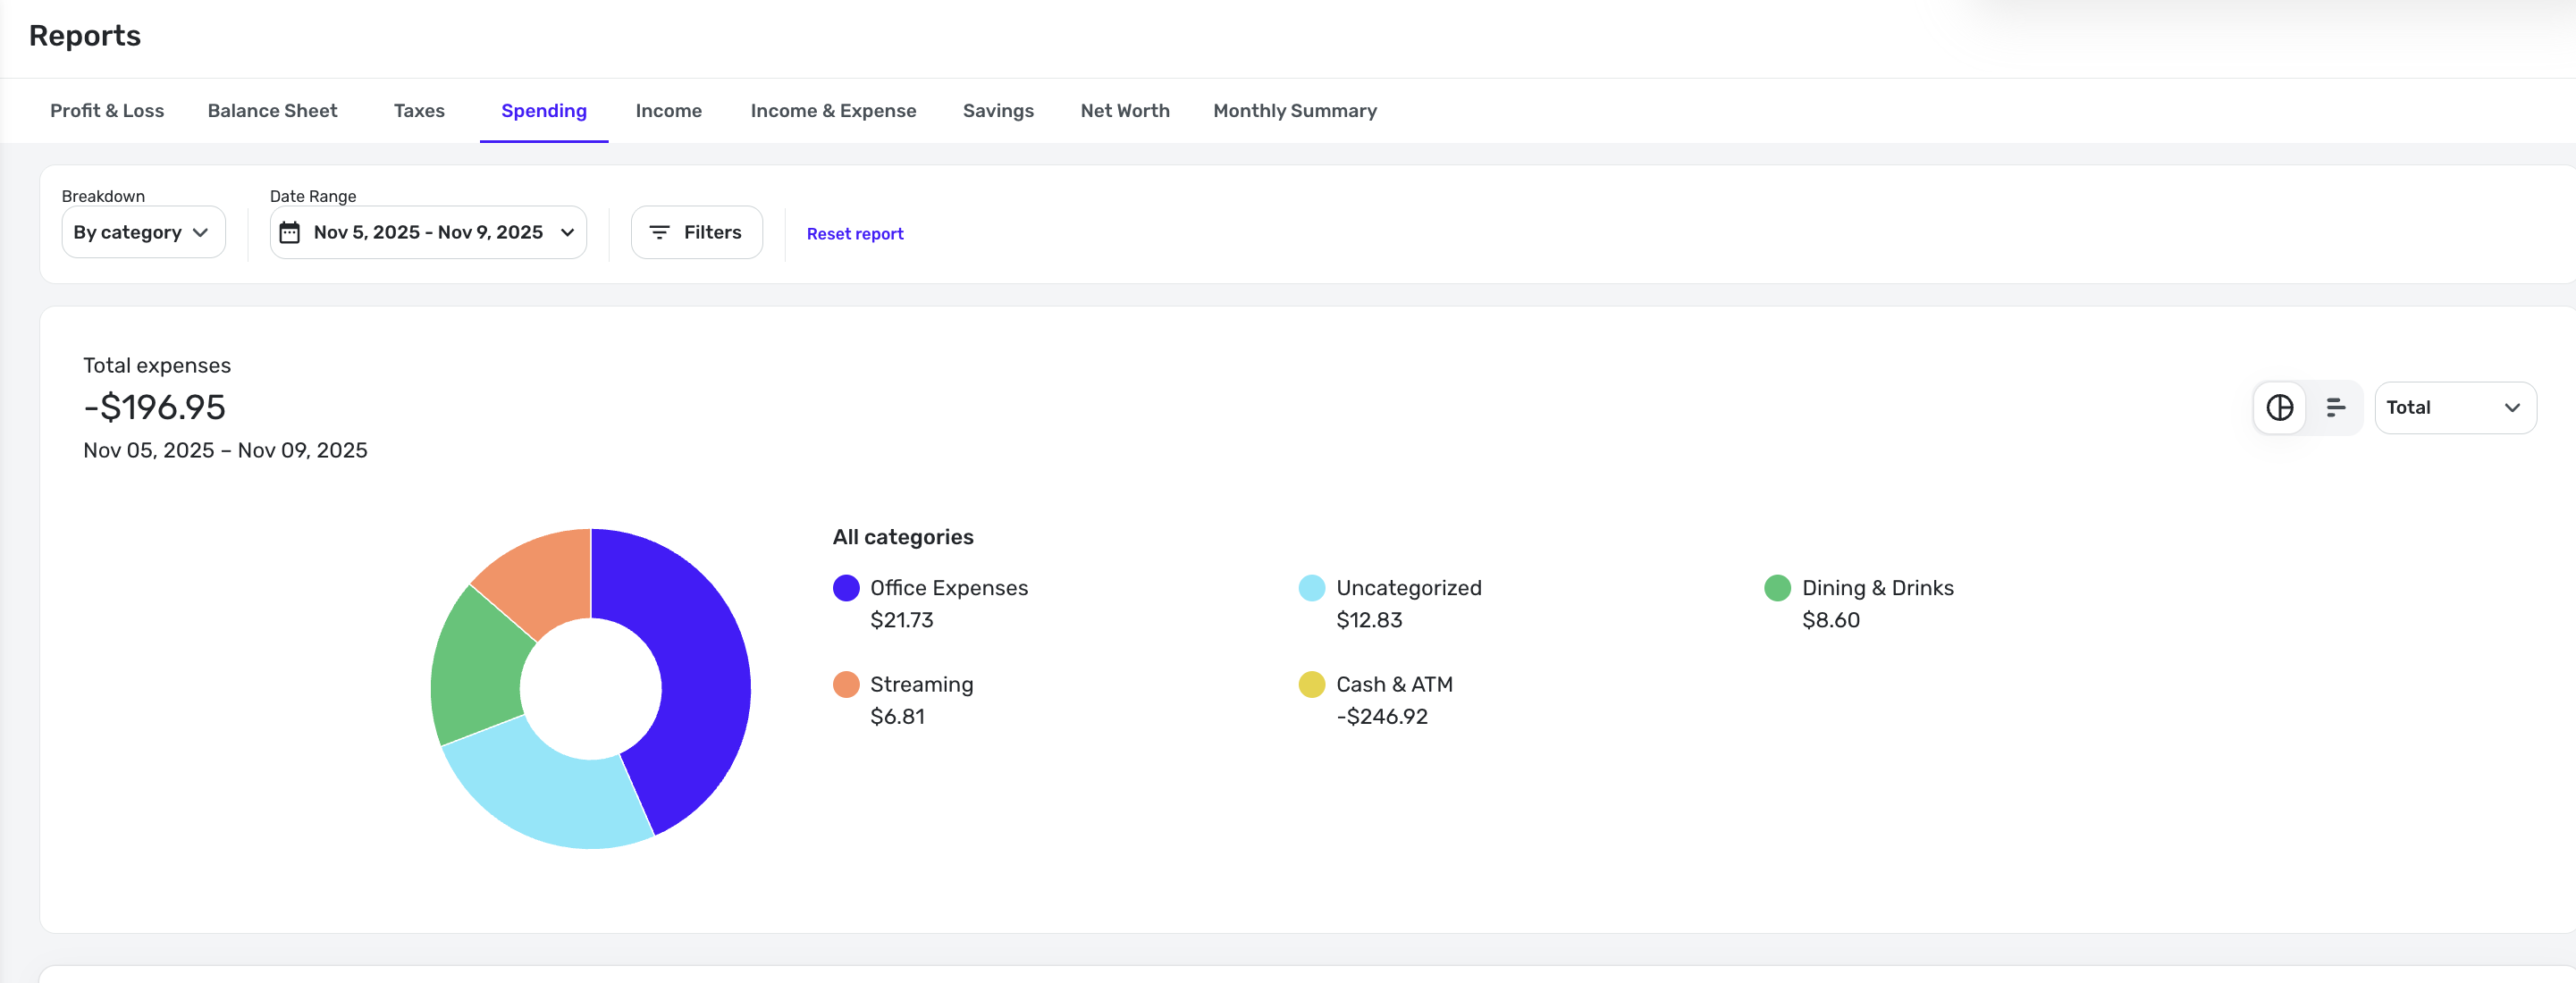
I get that there is 'negative spending' because the credits outweigh the expenses, but i've done similar charts before where it was negative, and there was still a category breakdown for the non-negative charges.
In other words, as far as I know, this behavior is "new", and it appears to be irregular.
-Rob
p.s. I tried this in chrome (including incognito which is virtual clearing of cookies/cache), and I tried it in Safari, with the same results. Mac OS Tahoe 26.1
—
Rob Wilkens - RobWilkens.com
Comments
-
Hello @RobWilk,
Thank you for bringing this to our attention! I see similar results in my Quicken Simplifi when I choose a date range for the Spending report that shows negative total expenses.
Are you seeing this happen exclusively with date ranges with negative total expenses? If not, what other circumstances have you observed that seem to trigger this behavior?
Thank you!
-Coach Kristina
0 -
Here's a 12-month example, it's blank here even though there is net spending:
—
Rob Wilkens - RobWilkens.com1 -
But if i changed it to over time and than back to total, it appeared, odd but a workaround maybe?
—
Rob Wilkens - RobWilkens.com1 -
And.. After doing that, a similar date range with negative spend works fine now
—
Rob Wilkens - RobWilkens.com1 -
Hello @RobWilk,
I am glad to see that you were able to get everything working as intended. I was unable to reproduce this issue myself, so it may have been a minor visual glitch that resolved on its own. In the future, if you encounter this problem again, I recommend selecting the 'Reset Report' option at the top of the report and then applying your desired date range to see if that resolves the issue.
-Coach Jon
1


