Enhanced Reports: Share your feedback here!
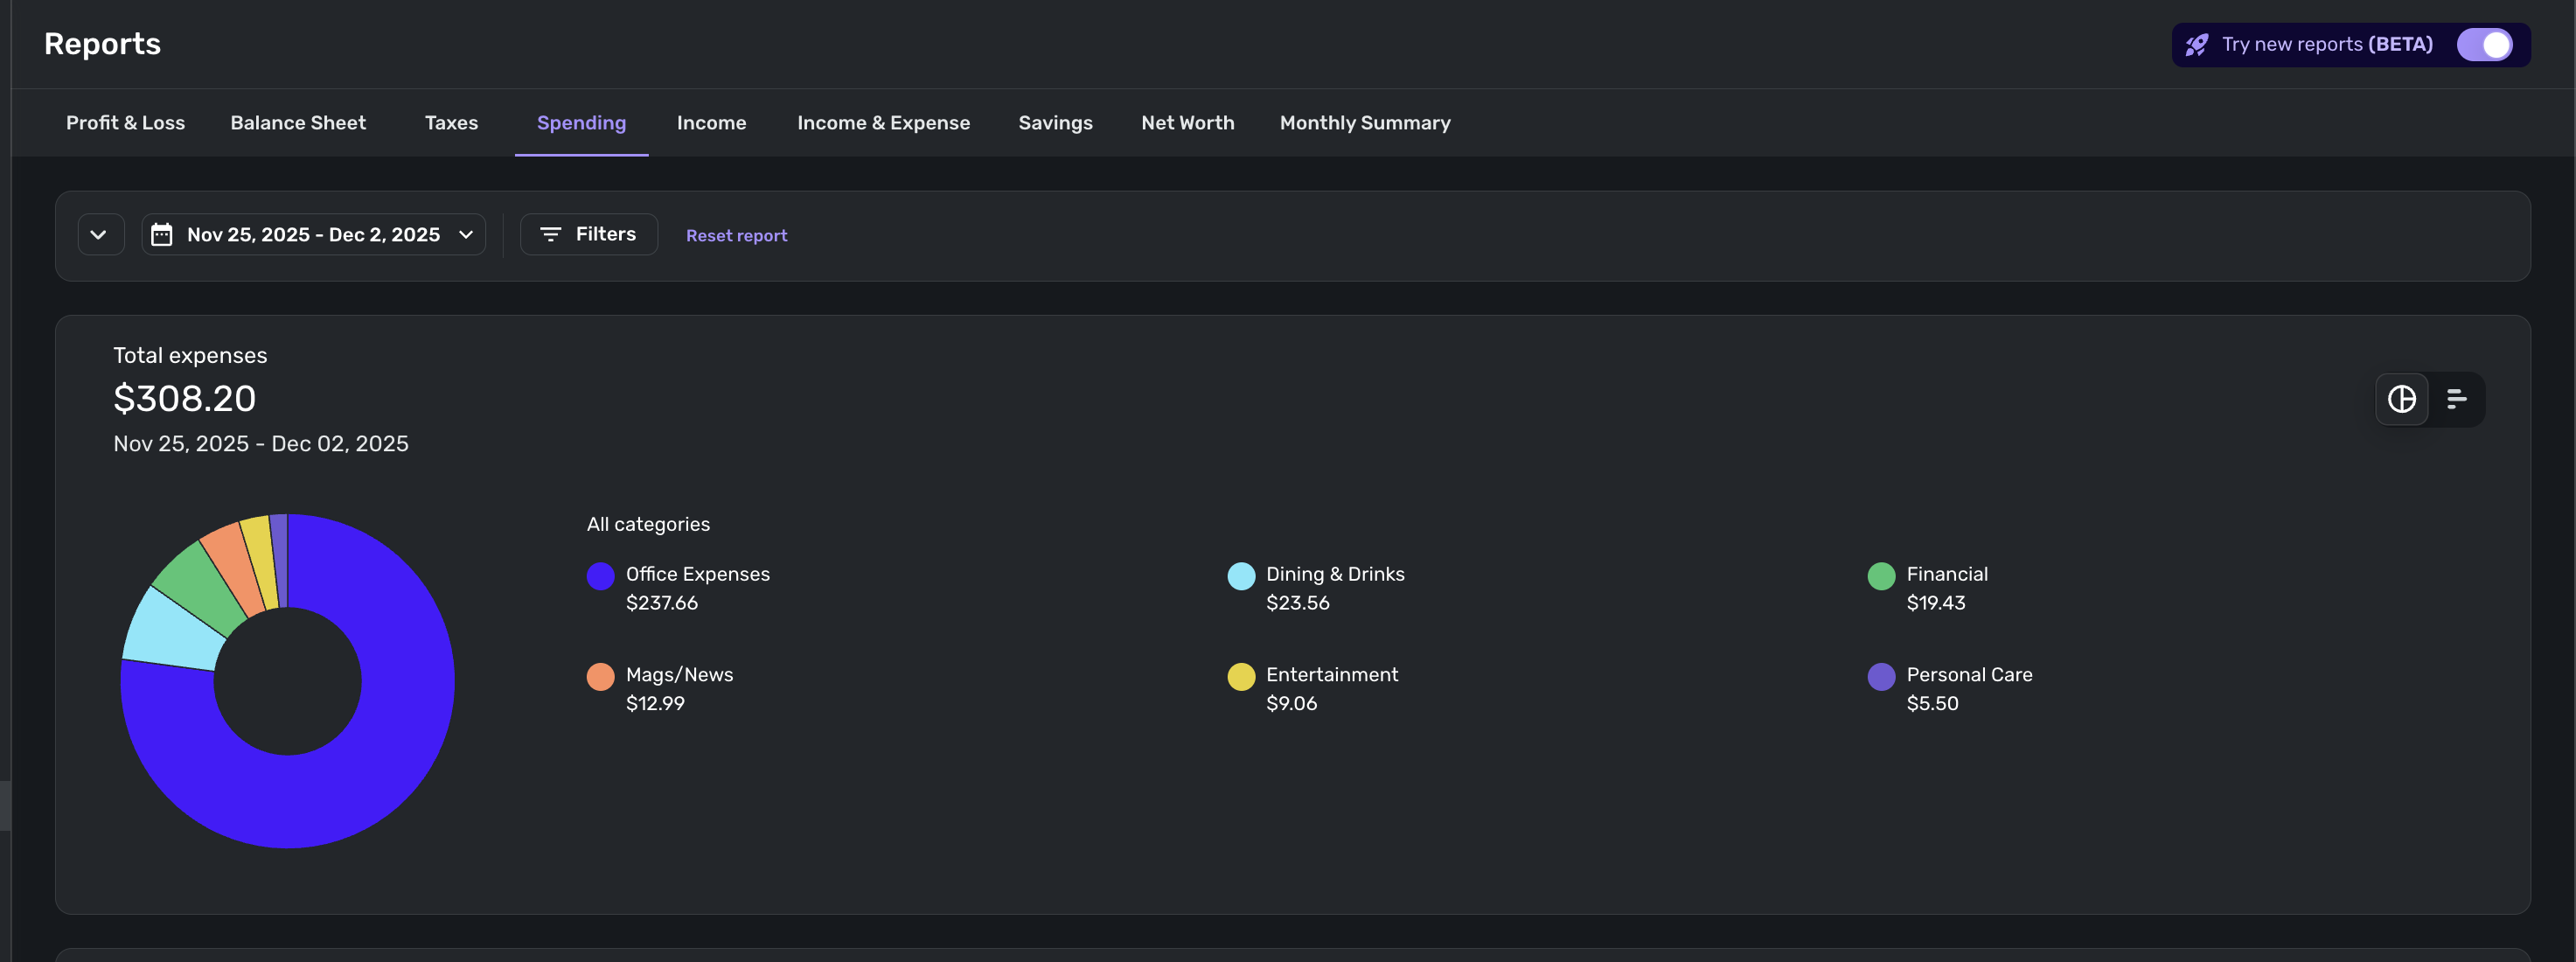
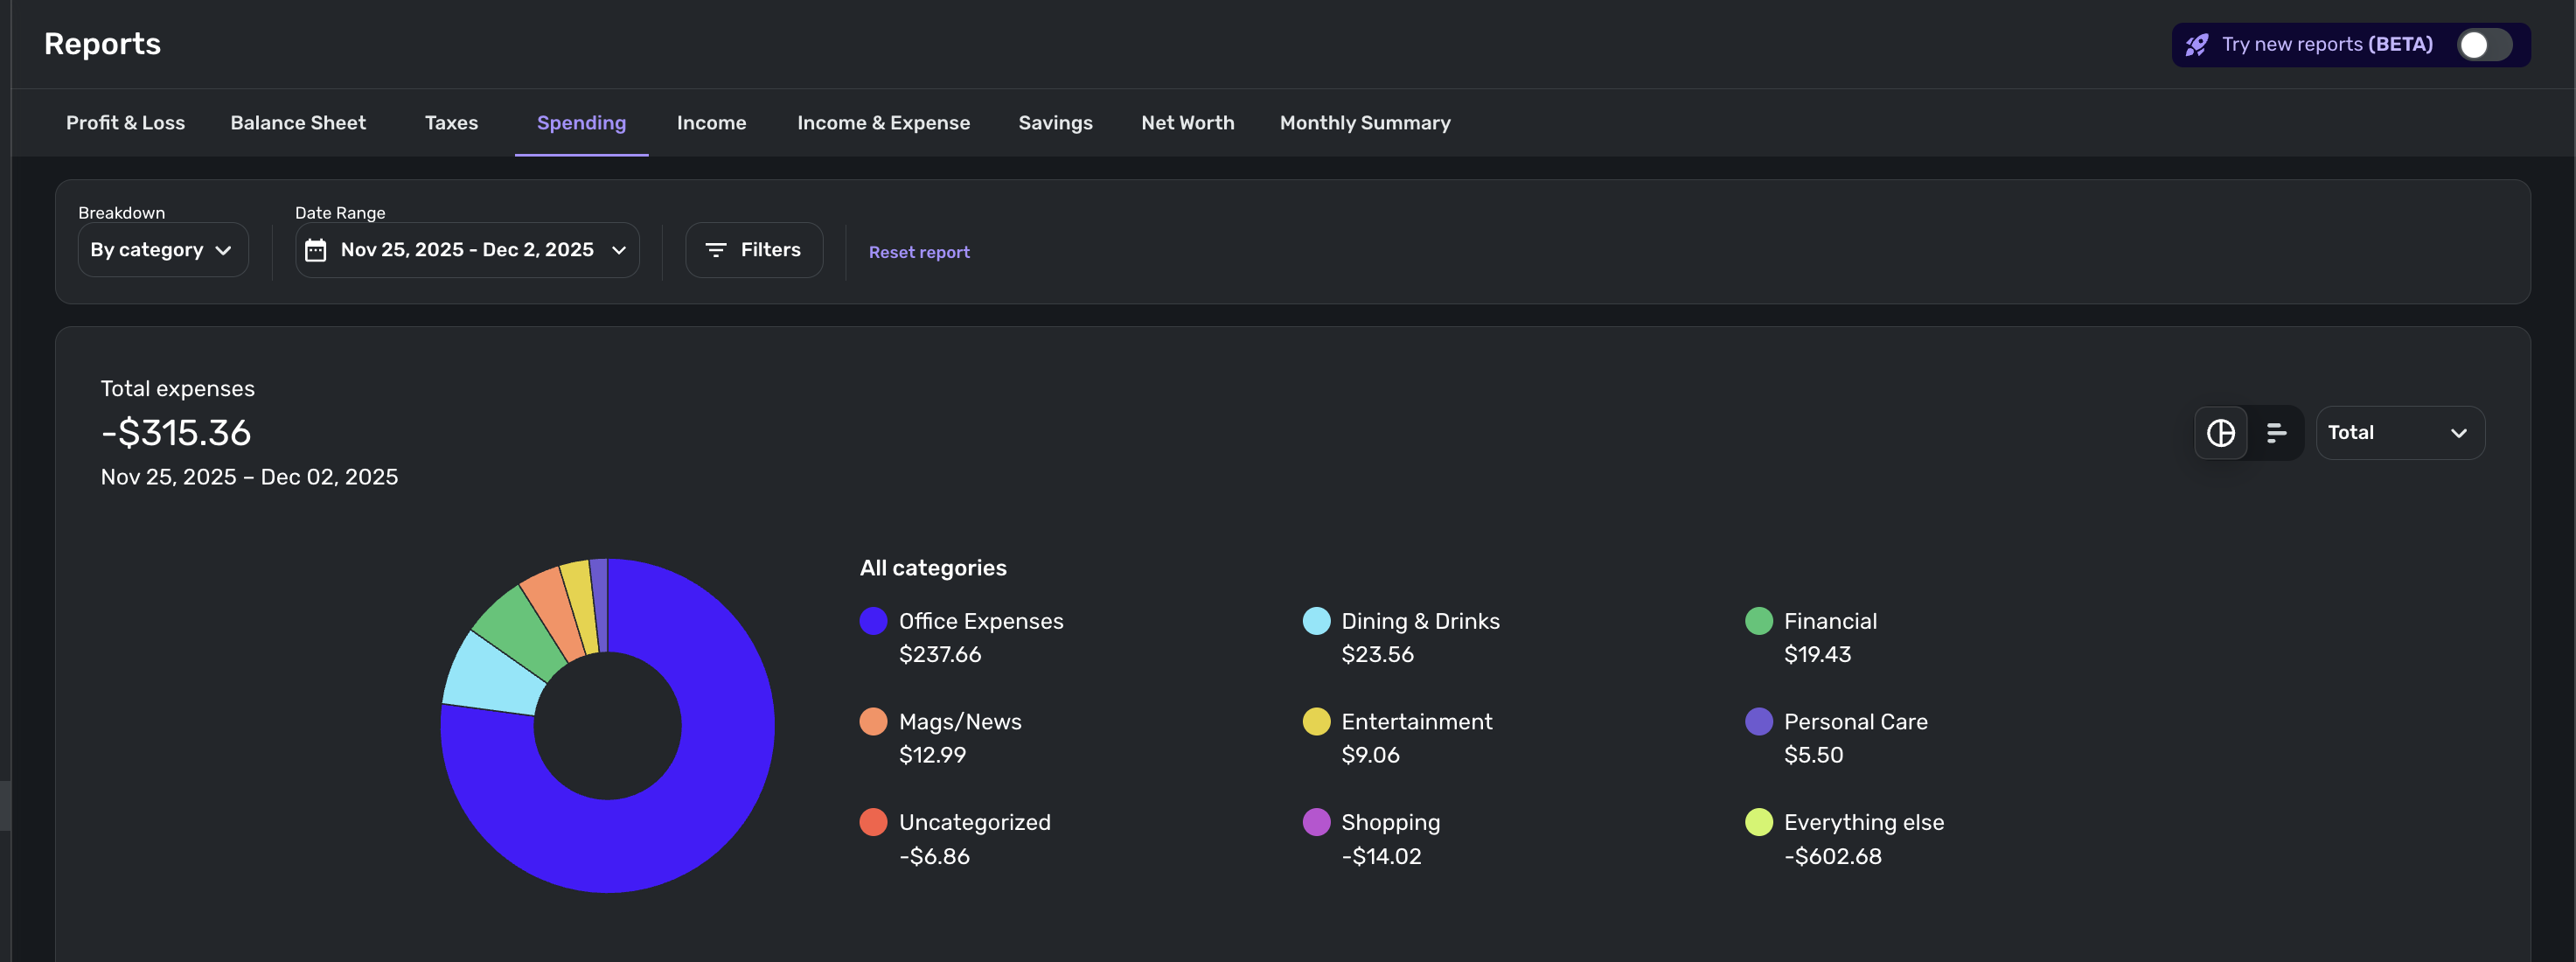
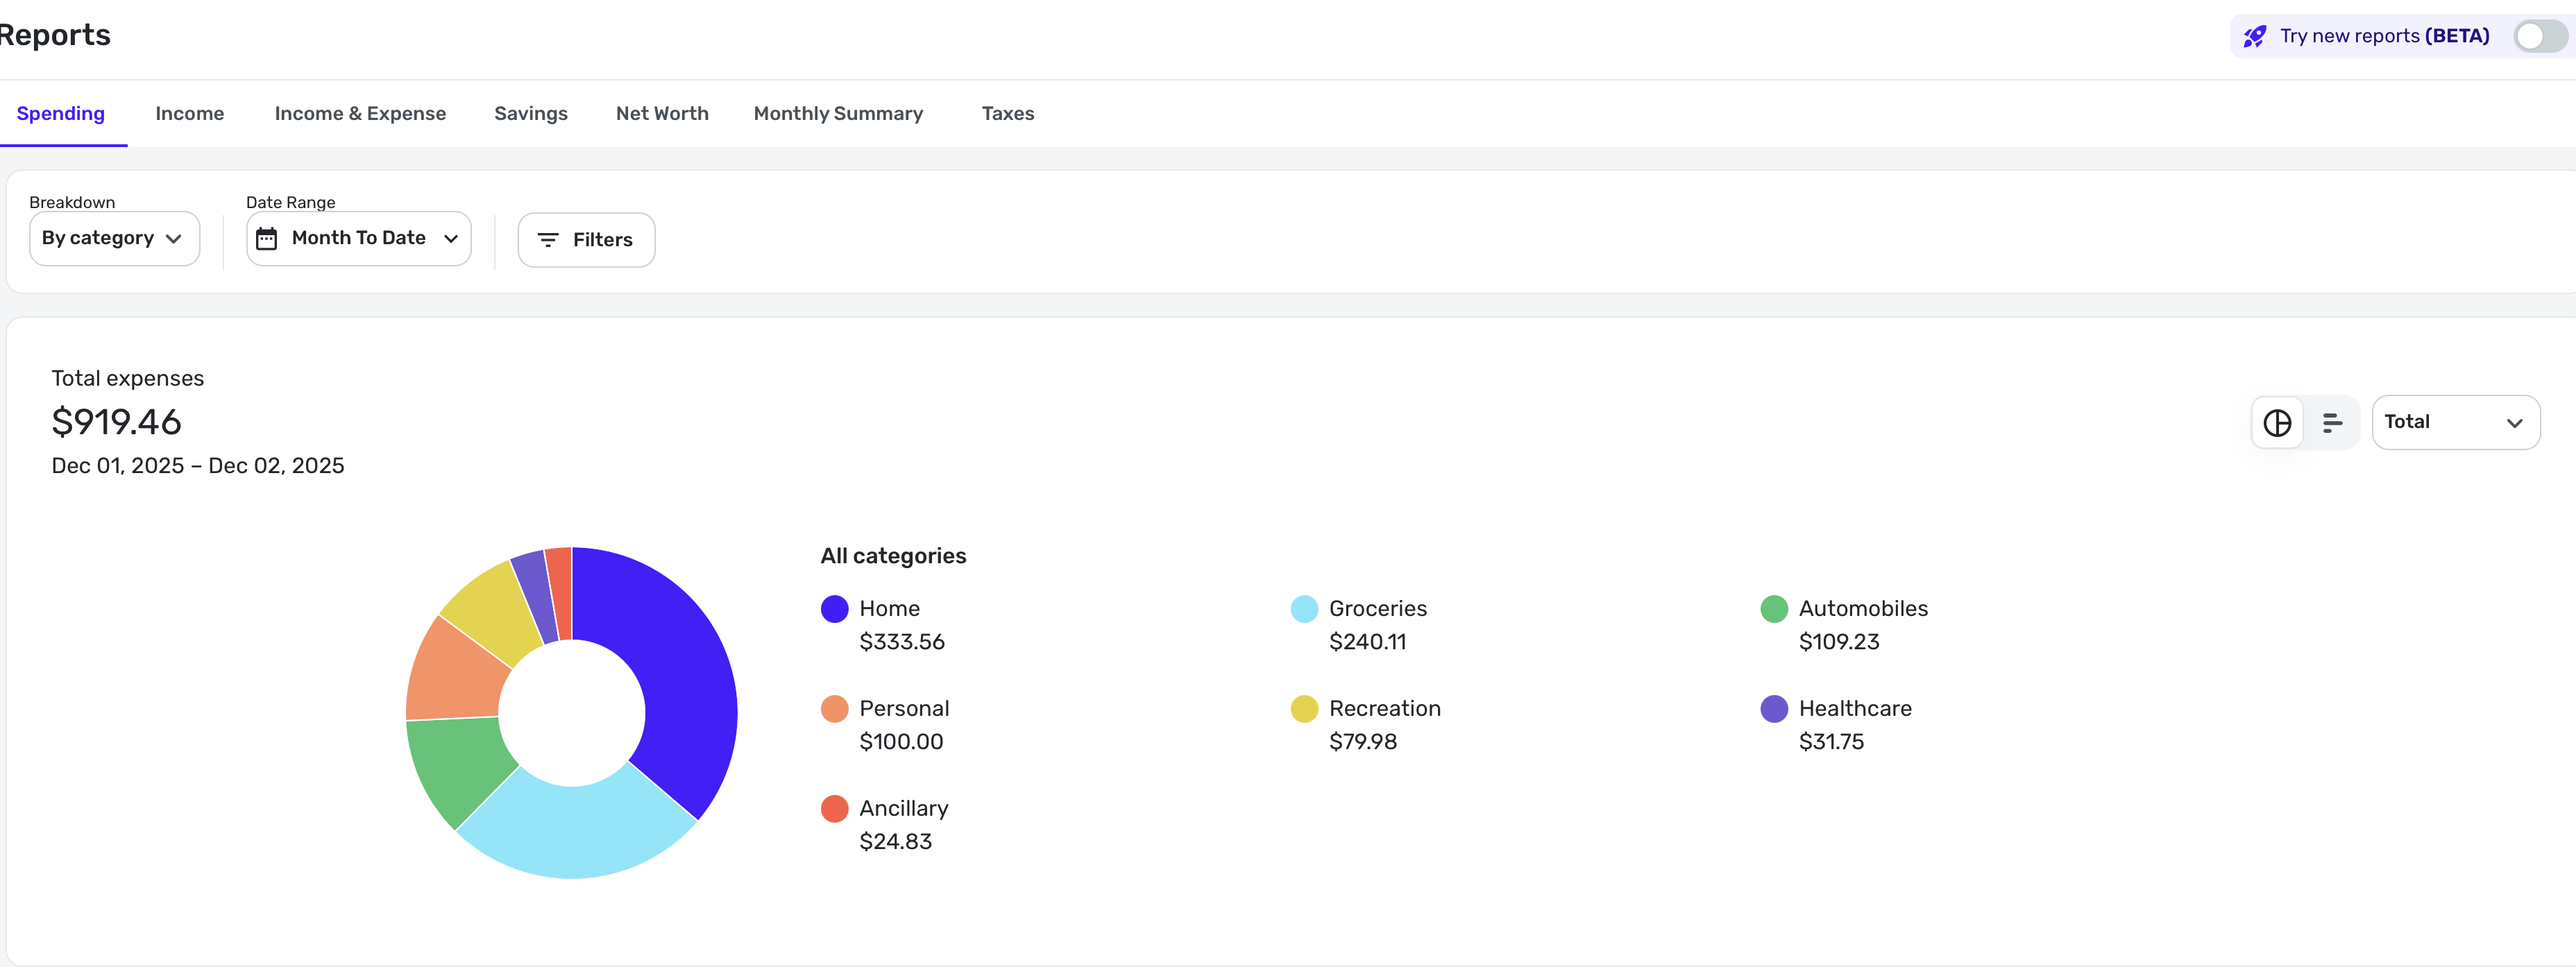
With the testing we’re doing on the new “beta” reports, it’s essential that we hear from our users. If you’re trying out these reports, let us know what’s working well—and what isn’t—by commenting below!
The announcement for this enhancement can be reviewed here:
-Coach Natalie
Comments
-
Very nice. This seems like it will be a boon for those who really like to "get into the weeds" of their spending and income.
I did notice that the column width adjustment capabilities don't seem to be working quite right. I can widen column 1 significantly (apparently beyond the page width), but the remaining columns not so much with only minimal widening and narrowing. Not sure if column width adjustment was meant to be included, but it's nice to have the option.
Danny
Simplifi user since 01/22
”Budget: a mathematical confirmation of your suspicions.” ~A.A. Latimer0 -
Column customization missing
The hierarchical register for the Spending and Income Reports (and perhaps others) does not allow full column customization.
As @DannyB mentioned, width adjustment is not available for most columns. But we are also unable to modify column order or select which columns to show.
DryHeat
-Quicken Classic (1990-2020), CountAbout (2021-2024), Simplifi (2025-…)0 -
There -really- needs to be customizable column selections (like there used to be) on the beta reports - -
Here's a good example:
I can see I spent $520 at Best Buy, which is a "Computers & Electronics" purchase, but if i want to know what the purchase was, I'd need access to the Notes column.
Also the specific category is ALWAYS listed TWICE at this point, for example, above you see "Computers & Electronics" on two separate lines. That's true throughout the report.
-Rob
—
Rob Wilkens - RobWilkens.com0 -
Agree with the others' comments. The Income & Expense Report is the one I still find most useful, but I do like the quick access buttons. I do hope these enhancements will come to the Taxes Reports to add features such as collapsing totals, showing payee subtotals, hiding transactions, which can be saved for printing purposes.
Edit: OTOH, I don't like that clicking on the Top Spending Categories dashboard card takes you to the lowest level categories immediately instead of drilling down as I prefer to do. So I have turned off the beta reports for now.
But I appreciate the changes and look forward to further refinements.
Steve
Quicken Simplifi (Safari & iOS) Since 2021
Quicken Classic (MacOS) Since 2009
MS Money (1991-2009) and Dollars & Sense (1987-1991)0 -
Need to be able to export all data rows and columns as before.
0 -
New reports remove the "over time" option for Spending:
BeforeAfter Enabling Beta I can still set it up as a bar-graph but it's just a total
1 -
Bug report- When I delve into the categories in the spending reports, I noticed that the each individual transaction shows up as $0 value even though the total of all transaction is correct. When I open the particular transaction, it shows the correct value. This happens across multiple categories and spending, income, income and expense reports.
1 -
-
Another suggestion is to get rid of everything else and show all categories.
The reports feature in iOS also needs an update with similar categories and ability to drive deeper into, rather than showing all transactions. I think those features have been requested multiple times in the past and it may be time to get it fixed now along with this update..!
1 -
@Bgz Good catch with the 0.00 transaction. I cannot believe I didn't see it myself.
Also, I agree about the "Everything Else.
I also turned the beta reports back on as I decided I needed to keep testing them. 😀
Steve
Quicken Simplifi (Safari & iOS) Since 2021
Quicken Classic (MacOS) Since 2009
MS Money (1991-2009) and Dollars & Sense (1987-1991)0 -
With Try New Reports (Beta) on or off most of the income Categories are zero for the month of November and December. The total at the bottom and the net income is appear to be correct. The previous months are correct.
0 -
@N4KHQ, thank you for reporting this issue to the Community!
Since the "Beta" Reports are in Early Access testing, I have merged your thread with the official feedback thread. The issue with amounts showing $0 has already been reported to our product team.
Thank you for your patience as we work to resolve this matter!
-Coach Natalie
0 -
Excellent addition! More analytics is always appreciated.
Immediate comment so far: I was there was an collapse all / expand all option at the top for easy maneuvering.1 -
Coach,
The beta version export is not user friendly at all. Please encourage the developers to figure out how the exported data can look just like the current version of exported data - one line per transaction. The beta version contains too many lines of "no real data" that makes any exported data cluttered and requires too much data smoothing work.
Thanks for listening.
1 -
With Early Access enable and new Beta reports never being enable. My category totals started being zero in November. I turned Beta reports on and off several times but did not fix the problem.
0 -
The $0 amounts issue is expected to be fixed this week!
-Coach Natalie
0 -
Another thought: I wish there was some toggle to expand the "View by Categories" to the first level of subcategories rather than going into each category separately. For example this view for all spending related to a tag:
I wish the blue Travel was actually two shades of that blue to show the proportions two subcategories.0 -
Hi DannyB thanks for the feedback. This is exactly why we're allowing people to turn on the new reports early so we can hear your feedback. Currently, the columns are auto-sized to fill up the entire screen and really only the first column has an unlimited variable width is why on big screens the first column is huge making it hard to read across the report. One idea we're kicking around is to auto-size the width of each column so that we accommodate the longest text, but probably cap it at some width so a single item doesn't make that one column really wide. This would also left justify the report content. Anyway, we are working on changing the column widths.
1 -
DryHeat, thanks for your feedback. Yes, we currently don't allow column customization but its good hear that this is a top priority for you. Quite honestly, the thing that's holding this up is remembering the widths and the column order. There are also 2 column views. The first one is the default report layout, but then there's the drilldown view that appears after clicking on a summarized amount and the transactions that make up that display.
0 -
Hi RobWik, Thanks for the feedback. Yes, being able to add the notes column is a great idea. Part of this report redesign is to provide more flexiblity like this.
We do plan to repeat the category or row item. In user testing, we found that this made it easier to visually see the heirarchy and which transactions were related to each other. With only 1 transaction, this isn't as useful but it becomes more useful if there are many transactions. We're also still working through some hierarchy changes.0 -
Clicking on Top Spending Categories should go to a drill-down of the categories. I'll write up that bug. Thanks for letting us know.
2 -
I noticed that negative spending (credits in spending categories) is missing from the new reports. Is this intentional?
—
Rob Wilkens - RobWilkens.com0 -
I haven't noticed this. My credit card rewards are shown as negative spending in the Income and Expense Reports.
Am I missing something or misunderstood?
Steve
Quicken Simplifi (Safari & iOS) Since 2021
Quicken Classic (MacOS) Since 2009
MS Money (1991-2009) and Dollars & Sense (1987-1991)0 -
This has to do with the difference in the way we create these reports. The Spending and Income reports are currently Detail reports, meaning they are focused on transaction data. The overtime graph requires Summary data with columnar values per month, so we actually don't have the data to draw the overtime chart. The solution is to add an option for you to change the Spending and Income reports into a Summary report so you can then get an overtime chart. We're working on the Summary report, but it isn't quite ready yet.
The bottom line is we'll be adding an overtime chart soon, but first, we need to ship the summary report for Spending and Income.2 -
Bgz, great suggestion. Part of the overhaul of our reports is to unify the functionality across both web and mobile. The presentation will be different, but mobile will have the full flexibility to display and define reports with rows and columns like on web. We are now building the mobile-first presentation of that data. Stay tuned.
2 -
This is a great idea. I'll write up a feature request.
0 -
@RobWilk Thanks. The beta reports show the second level categories instead of the top level categories, and I prefer the latter so that you can drill down as you like.
What I don't understand is why the total amounts differ, which is weird. Here's mine:
I am pretty sure the Beta Report total is wrong (confirmed by checking the income and expense report). I haven't figured out why yet.
Steve
Quicken Simplifi (Safari & iOS) Since 2021
Quicken Classic (MacOS) Since 2009
MS Money (1991-2009) and Dollars & Sense (1987-1991)0 -
Another suggestion - I feel moving the cash flow analysis (from bills and income) into reports makes a lot of sense (at least to me). I am not sure if others would agree.
If we add custom date ranges to predict cash balance in a particular account that would be awesome. Currently, we have only a few preset intervals and I end up calculating cash flow manually.
0 -
@RobWilk I figured out the discrepancy in the sum totals between the Beta Spending Report and the old one. The $1.50 difference is a negative expense for a rebate. The new report shows it below the charts.
So the final total is right. I can live with that, but I think it would be better to show that same total at the top as well to avoid the confusion, because negative expenses like refunds are not spending.
Steve
Quicken Simplifi (Safari & iOS) Since 2021
Quicken Classic (MacOS) Since 2009
MS Money (1991-2009) and Dollars & Sense (1987-1991)2


