Enhanced Reports: Share your feedback here!
Comments
-
So much for my brilliant plan! So could it be the transactions themselves that are triggering this?
If you choose later years like 2024 and 2025, do you get the errors?
How about if you do an Income and Expense report for 2018 instead of the Spending Report? What does it show?
Steve
Quicken Simplifi (Safari & iOS) Since 2021
Quicken Classic (MacOS) Since 2009
MS Money (1991-2009) and Dollars & Sense (1987-1991)0 -
"So could it be the transactions themselves that are triggering this?". Not sure how we'd go about determining this. Just seems weird that it's only these specific transactions, and it's not consistent across time frames. Choose a 3 month window in 2018, and the pie chart shows normally with the new Charitable Donations category, no "Unknowns" at all.
"If you choose later years like 2024 and 2025, do you get the errors?" Yes, that's when I first noticed the issue, when I was reviewing my 2025 expense report. I also chose "Recent 6 Months" in the time period drop down, it does the same thing. If I choose "Recent 3 months", it looks normal. I set a time period of Jan 1, 2025 - Aug 31, 2025, the pie chart graphic is messed up, if I set Jan 1, 2024 - Aug 31, 2024, the pie chart graphic is normal.
"How about if you do an Income and Expense report for 2018 instead of the Spending Report? What does it show?" The Income and Expense report only shows those two categories in the graphic, and since these are all Expenses, it looks normal. The transactions listed below the graphic are correct, but they are also correct in the list below the Expense Report graphic. It's as if whatever is configured to create the pie chart expense report graphic is having trouble reading the actual transactions under certain time period conditions, not pulling the category info correctly, and so defaulting to "Unknown" for those transactions. But I have yet to determine a consistent pattern that triggers this.
0 -
@mtrow28 I only have data back to 2021 and I couldn't reproduce it.
Reclassifying all the transactions as new Charitable Donations would be the same I think as editing them somehow in case certain ones were corrupt. I guess you could choose all the Charitable Donations transactions and add a note such as test or mark them unreviewed or something. Later you can mark them all reviewed again.
Anyhow these are the things I would have done. It may well be a bug but how to debug something that is still in testing? Which is what these reports are.
I was going to tell you to turn off Early Access, but it doesn't seem to make a difference for me. I thought the reports were still in Early Access. You can try it anyhow.
Steve
Quicken Simplifi (Safari & iOS) Since 2021
Quicken Classic (MacOS) Since 2009
MS Money (1991-2009) and Dollars & Sense (1987-1991)0 -
Well, I should have asked that first. LOL. But I have such a hard time keeping up with what is what. However, it could still be some corruption or it could be a bug or a bit of both. The product people monitor this site and we gave them more data to consider so they will probably be in touch with you at some point.
Sorry I wasn't any help, but it is always interesting to me to troubleshoot.
Steve
Quicken Simplifi (Safari & iOS) Since 2021
Quicken Classic (MacOS) Since 2009
MS Money (1991-2009) and Dollars & Sense (1987-1991)0 -
Enhanced Reports are now live for ALL Quicken Business & Personal users! We will enable all Quicken Simplifi users soon as well. Stay tuned!
-Coach Natalie
0 -
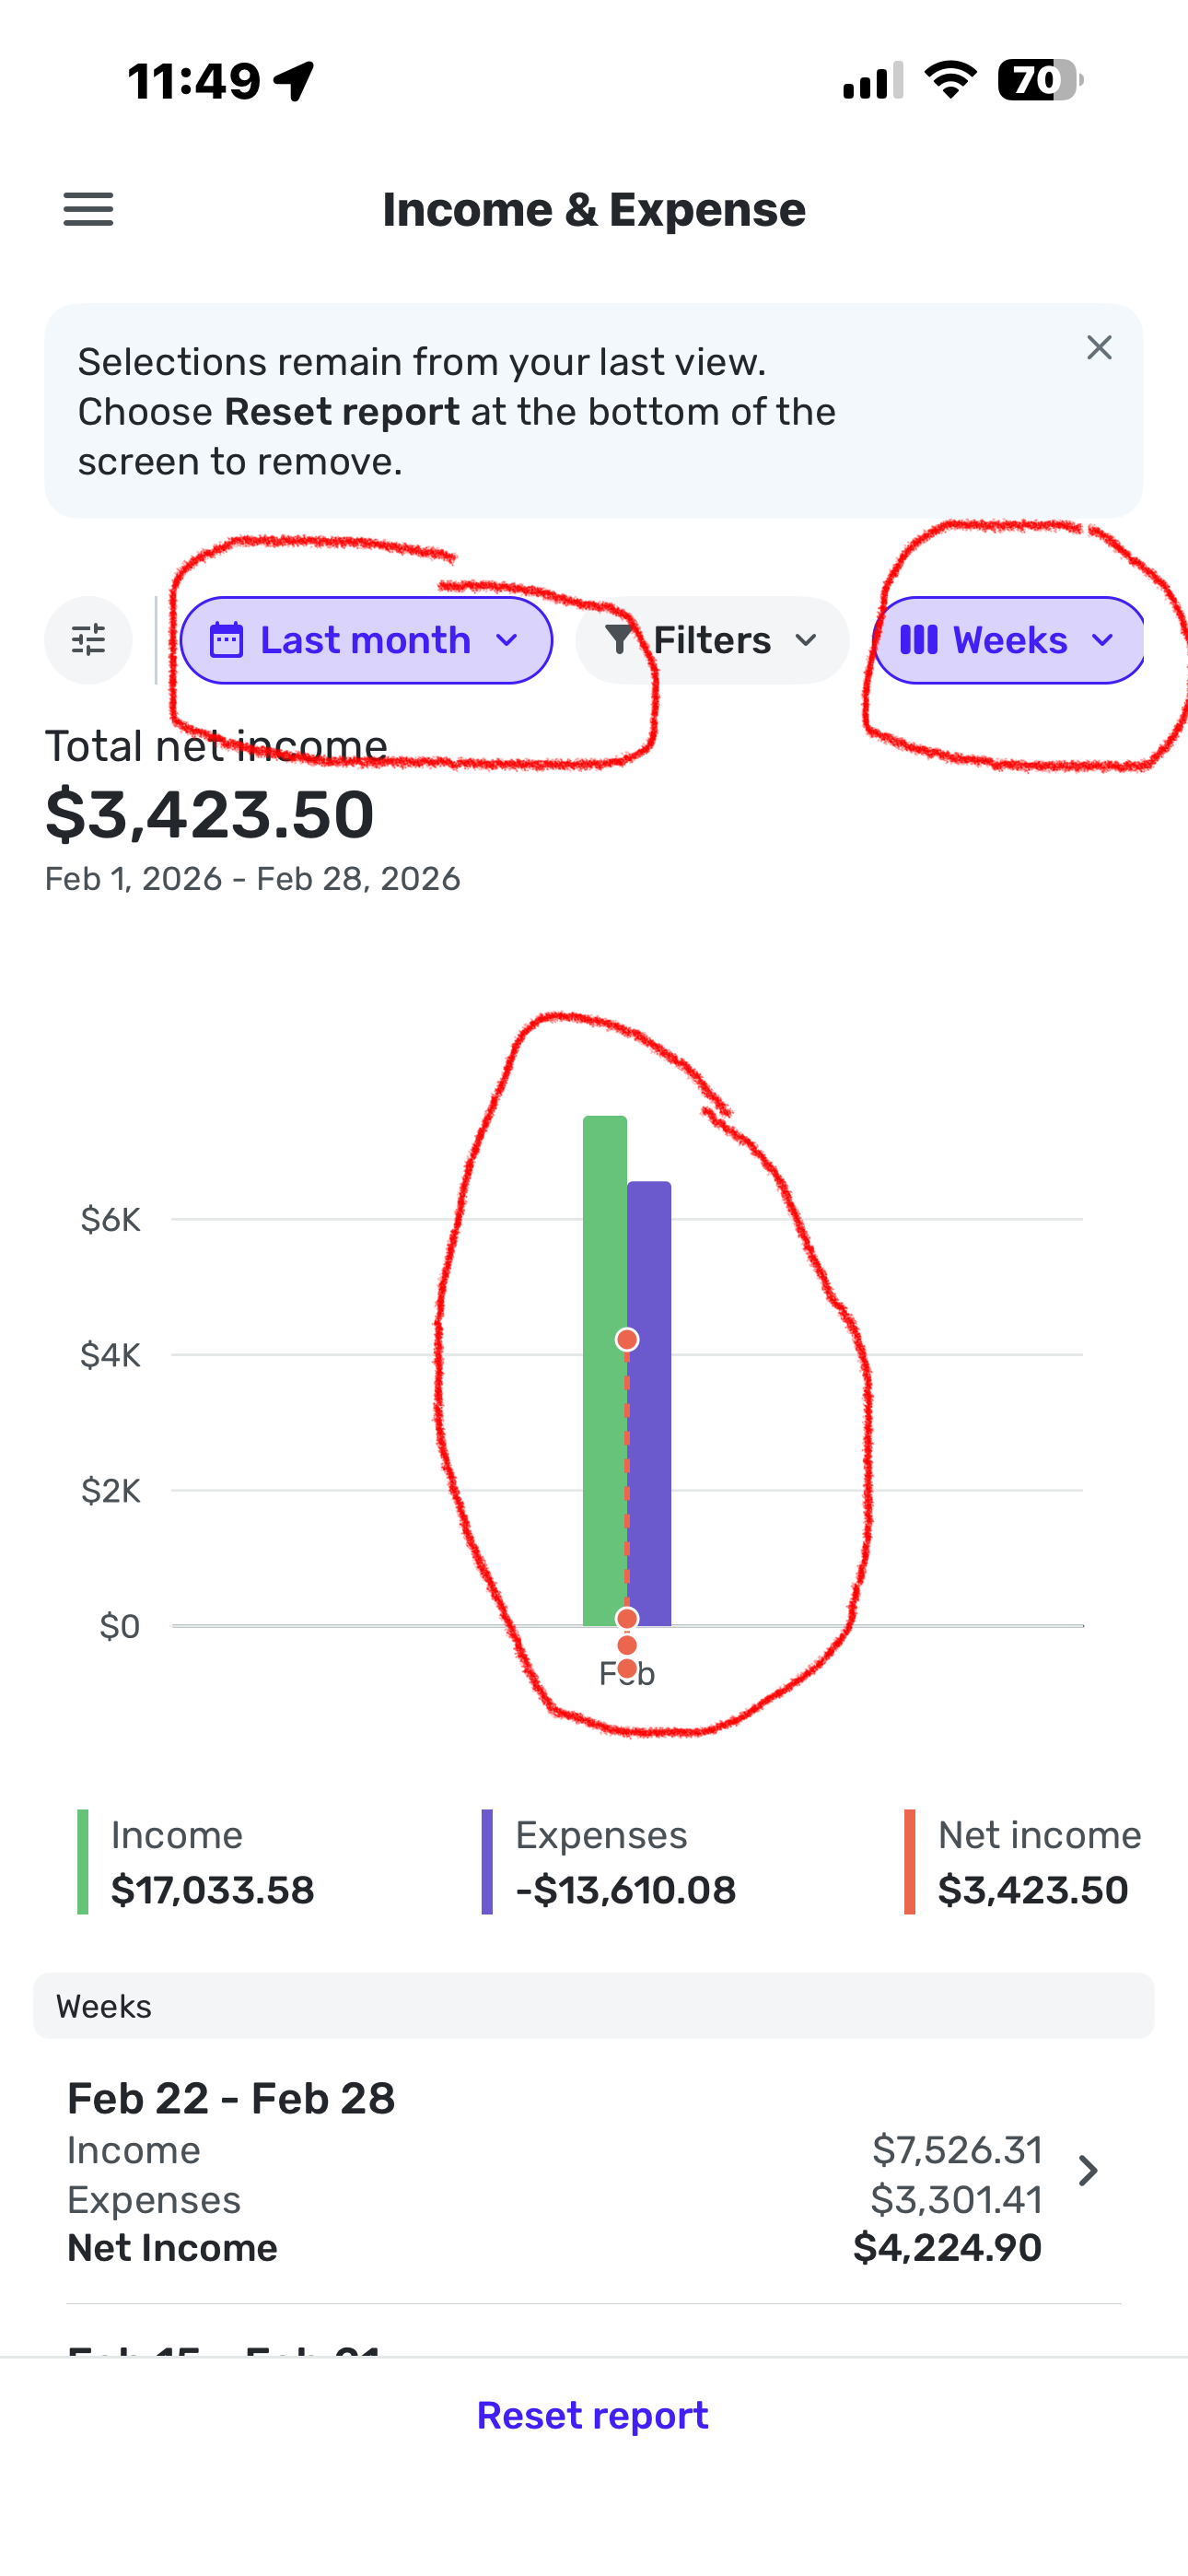
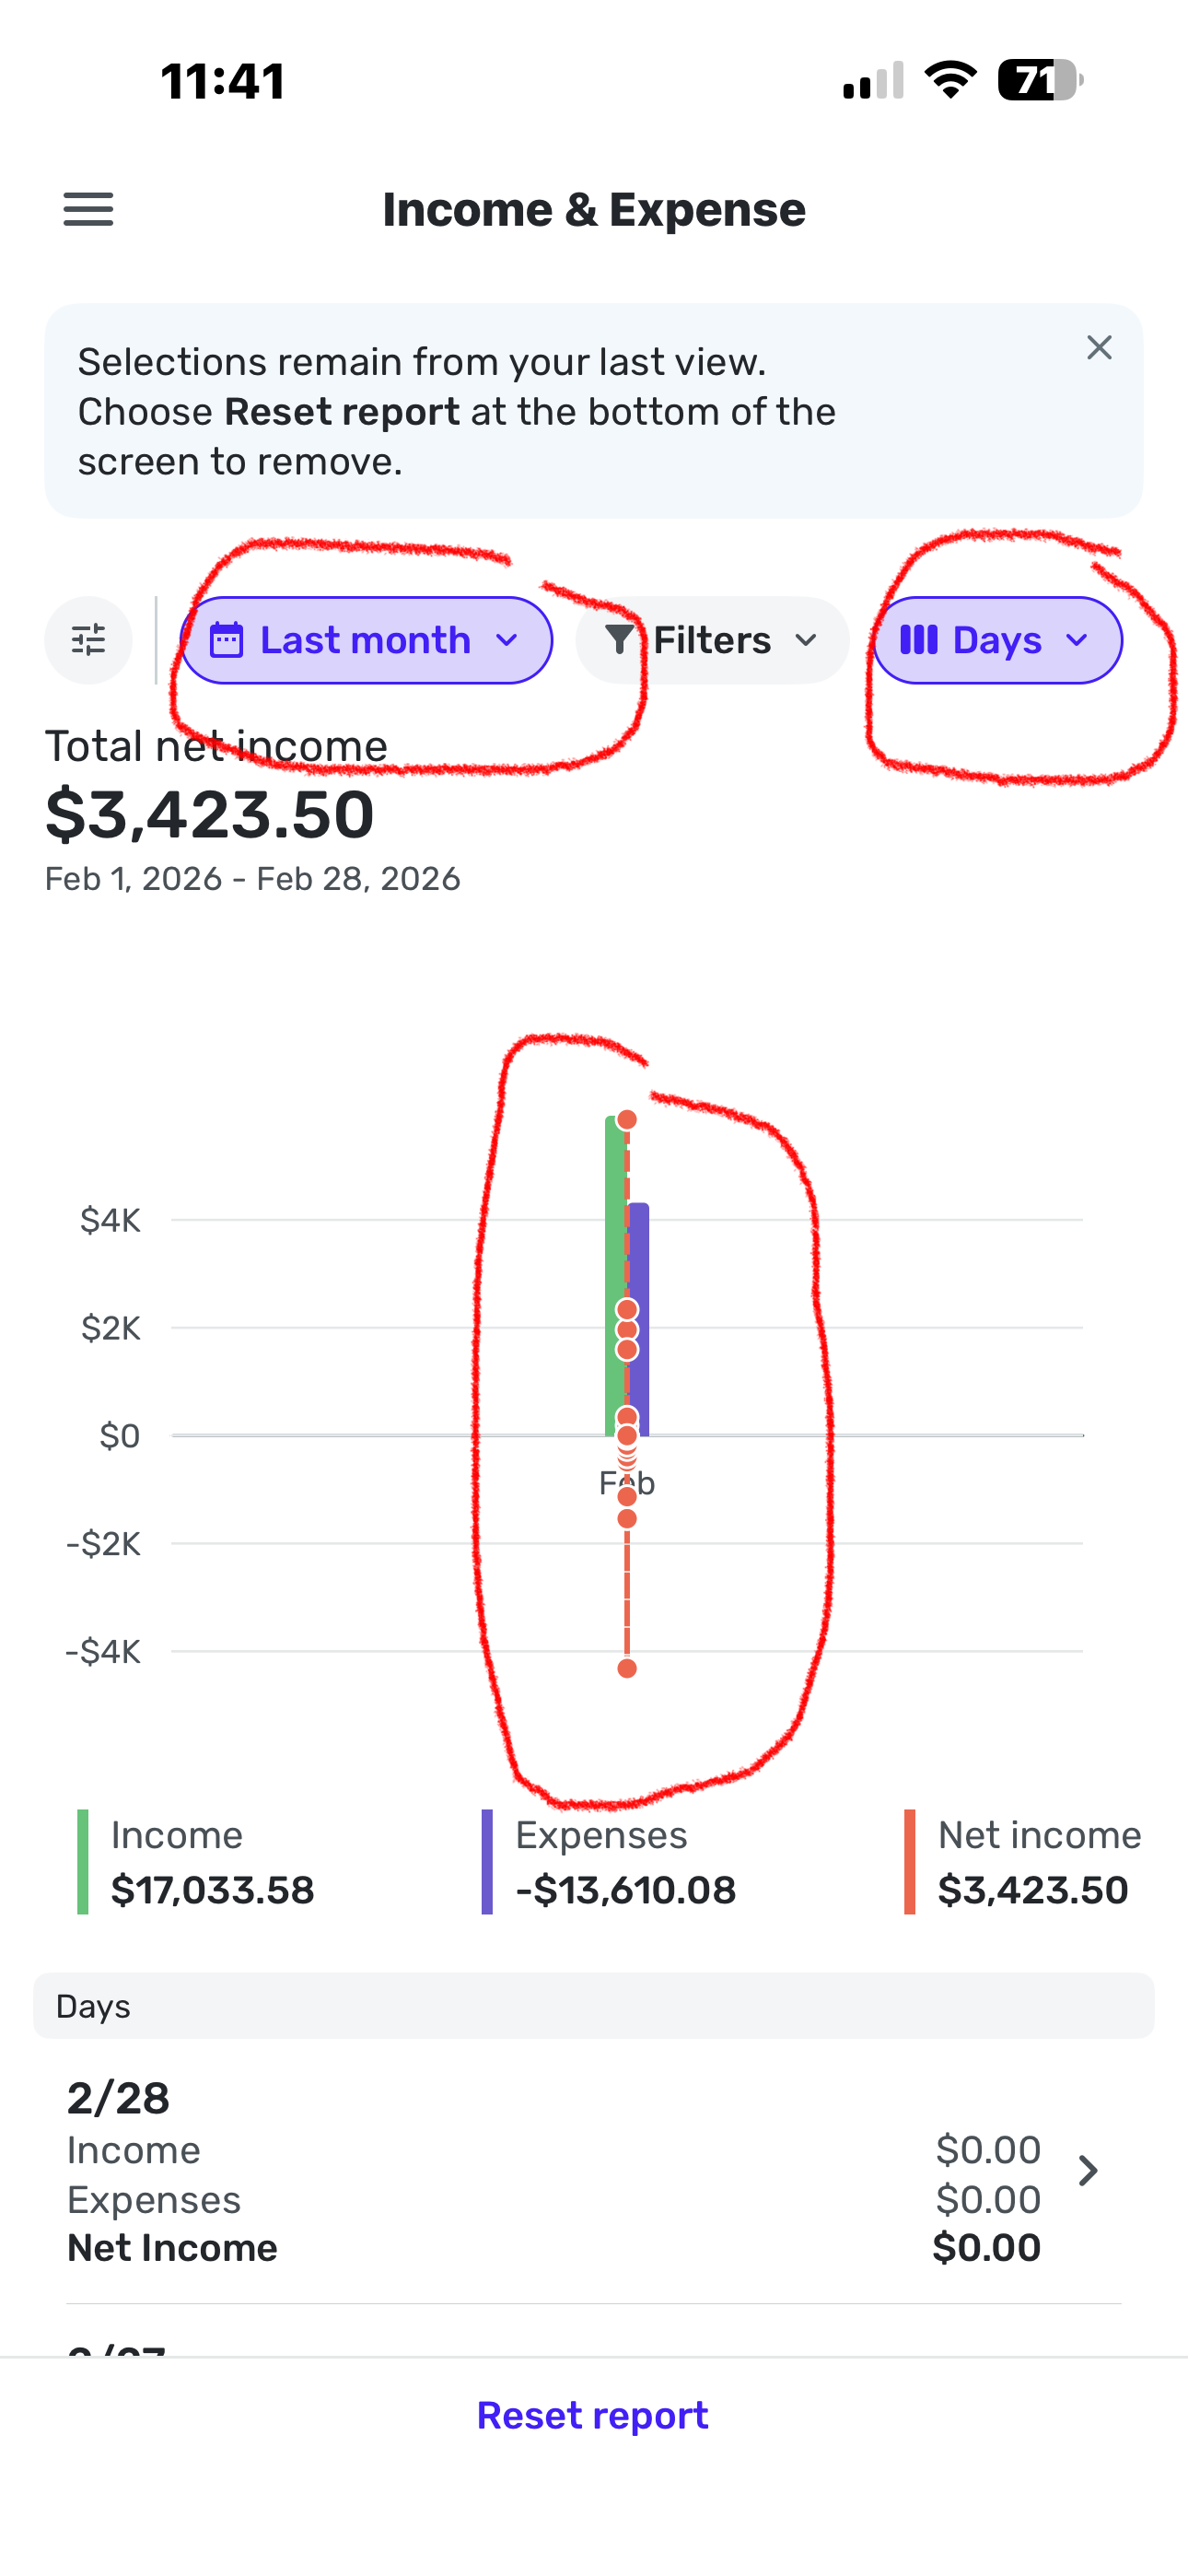
Just tried mobile reports today for Income and Expenses on iPhone. When selecting current month or last month, the bar chart is totally compressed and unreadable. Switching to last 3 months date range, its very readable. Not a huge issue to me but wanted to report it
0 -
-
-
I created an annual income and expense report for 2025
Several categories where refund checks or card refunds that were showing 'correctly' in green+
The CSV export made ALL numbers positive including these negative expenses. As a result when I did and Excel sum for each month across all categories it was not consistent with the exported report total. (Took me while to figure out what had happened!)
0 -
Wow that worked but UI is confusing. 2 lists that look similar, but no immediate indication on mobile that right list is 'group by'. I'd have thought grouping should not default to 'Days' on narrow screen mobile device. Offer a more readable grouping by default like Month
Thanks for clarifying
1 -
Hello @RobI,
Thank you for letting us know you encountered this issue. To help troubleshoot, please provide more details. When you exported to CSV, did you create a flat CSV or a nested CSV? When you say annual, do you mean you chose the last 12 months timeframe? If not, then which timeframe did you select?
I look forward to your response!
-Coach Kristina
0 -
It was nested
It showed the last 12 months by month with totals for income and expenses
1 -
I have the same issue. Not sure why the "old" export functionality had to change, it worked perfectly fine. Now the system can't differentiate properly between positive and negative values for the non "Total" line items — or the "subcategory" as they are now called (and now column seperated in the export which is annoying to fix every time).
To replicate: and say on cash based accounting, have a subcategory with $20 (-20) of expenses in month 1, and in month 2 you refunded the $20 (so now it is +20). The excel report will show $20 for each month — and not properly show that month 1 was -20 and month 2 was +20. So the export data is incorrect. To note: for some reason the "Total Expenses" line item is able to show negative values
0 -
Thanks for your replies! Can you please confirm if you both currently have Early Access turned on in Quicken Simplifi? I was unable to replicate this issue on my end with it turned on, so if you do not, I would verify whether turning on Early Access and using the new Enhanced Reports resolves the issue reported here!
Let us know!
-Coach Jon
0 -
Turning on early access did not fix the issue. To note: I was able to replicate this issue across browsers as well.
0 -
Hello @jmach,
Since the feature you're referencing is related to the new Enhanced Reports, which are currently in Early Access, your post has been merged with the official feedback thread so it can be viewed by our product team.
Thank you for bringing this to our attention!
-Coach Jon
0 -
Hello Simplifi folks. I was looking at using the Simplifi reports in place of my current monthly creation of a spending report from downloaded-to-CSV transaction and/or income/expense report data. I saw this:
- Finally, these Reports can now be
exported directly to CSV or Excel, making it even easier to analyze your information or share it elsewhere.
If the export to Excel functionality is to continue to be supported, I have the following comments.
- I'd suggest that the expense values not be negative numbers.
- There is a discrepancy in the format of the fifth column of data. That column has a dollar sign "$". Example from an export to Excel file "Simplifi - income-expense.excel.xlsx" :
Fees & Charges (Other)
-2.16
-74.04
-2.16
-2.16
-$2.16
-2.16
-84.84
Thanks.
0 - Finally, these Reports can now be
-
@dsfreddy is there a reason you do not want them as negative? It seems like negatives are usually expenses and positives are usually income. If you took awas the signs you would not know which are which.
Steve B
Ex Fortran, Cobol, Basic, MS Access and VBA (Visual Basic for Applications programer
Been using Simplifi since Dec 2026.
0 -
I wanted to update people on how we're going to be treating excluded transactions for now.
- They will appear grayed out, and the number will appear, but they will not be included in totals or calculations in the report.
- They will also appear in PDF reports the same way.
- In CSV exported files, they will appear, but we're adding a column for Excluded from Report, and there will be a value of "Yes" if the transaction is excluded. We needed to do this since there's no way to "gray out" a CSV transaction. If it's not excluded, this column will be blank. The hope is that this will make it easy to spot the excluded transactions. These transactions will display their correct amount, but as always they won't be included in totals.
- Eventually, we will add an option to Show Excluded Transactions because by default we'll hide them but this will come later. These changes will be rolled out shortly by the end of March.
1 -
Confirming I'm using the early access reports.
I only noticed this 'error' by chance as the totals weren't agreeing when by chance I tried summing a column to validate my spending totals for the year. I could easily have missed the issue in Excel
0 -
@sbennet1 Thanks for the question. First of all, I'm only referring to the "Export to Excel" file downloaded from the Income & Expense report. If Simplifi folks intend to retain this functionality, I'm suggesting that eliminating the negative signs in the values that are summarized by the outline function in Excel makes the report more readable. (If Quicken/Simplifi is not going to retain this Excel export capability, then my point is moot.) Other things are possibly going on in the CSV exports and the web-displayed reports, although I note that the default for the web Income & Expense report is to not show expenses as negative.
The way I look at it is this: Net income is income minus expenses. If the expense numbers are negative, then net income becomes income plus expenses, at least in a simple Excel formula. I'd rather stick with income minus expenses. The outlined values in the excel exported report already segregate income and expenses, so it seems clear to me which is which. Also, I usually interpret a negative expense as a refund or something similar.
Ultimately, I'm looking at replacing my monthly Excel-based income and expense report, created from downloaded transaction data, with Simplifi's Income & Expenses report. If I could download that report to Excel, and print it without additional processing, that would serve my needs.
0 -
We moved the old Spending and Income reports to the Transactions view so they are still available.
We didn't add the flags filter to the new report because usage was low, but we can consider adding them back. Can you tell me more about your specific use case? It would be great to better understand the bigger picture because it's possible there are other ways to address it.
1


