What happened to Spending by Month Report? (edited)

With the latest app update I no longer am able to access "over time" reporting. I use that to keep track of my spending in certain categories by month. Is it hidden?
Comments
-
Hello @elishearn,
Thanks for reaching out! I am not sure what you mean by "over time" reporting, but you can access the Spending Report via the Reports tab in Quicken Simplifi, then filter it by category and the desired date range as you prefer.
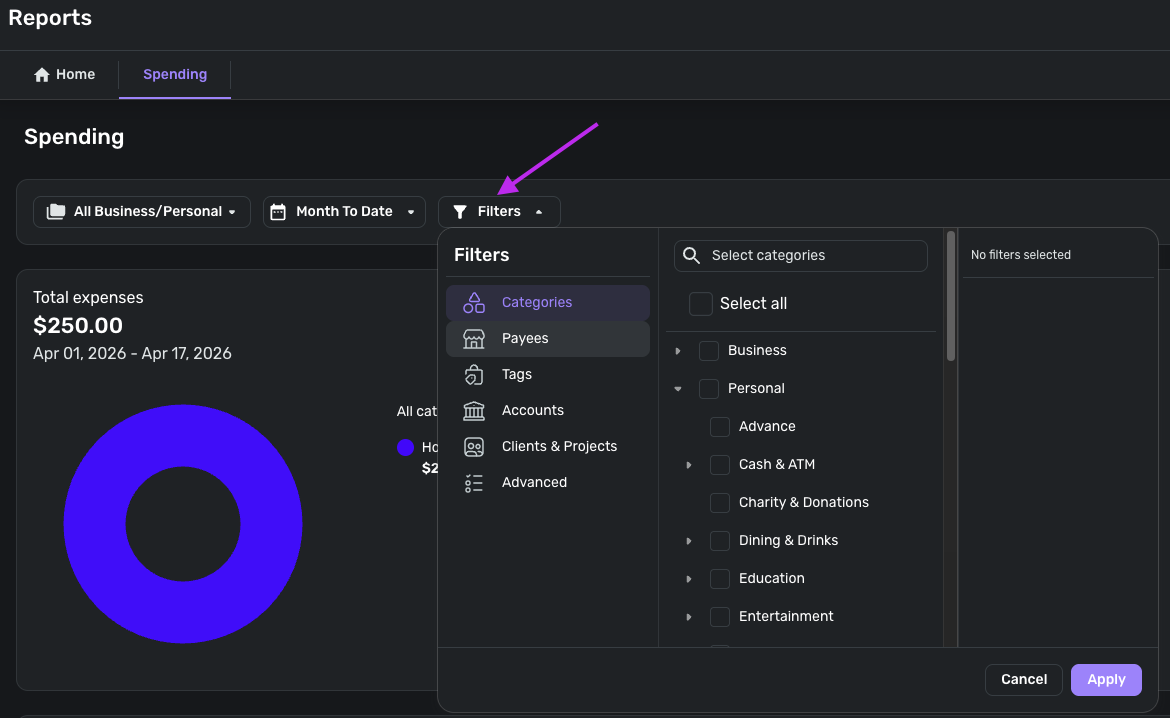
More information on how to access and use Reports in Quicken Simplifi, specifically the Spending Report, can be found in our support article here:
If the Spending Report isn't the one you are looking for, be sure to let us know so we can assist further!
I hope this information helps!
-Coach Jon
0 -
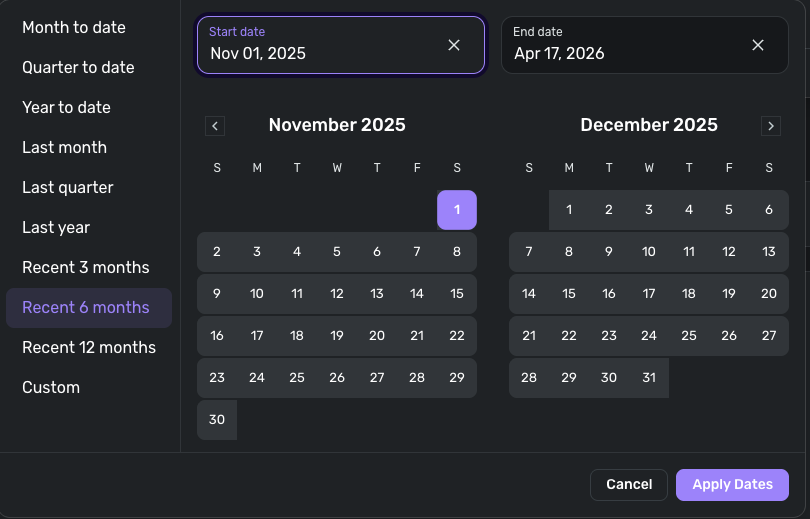
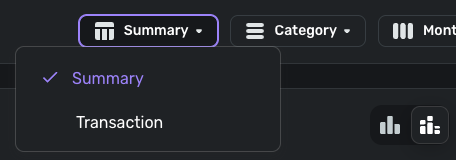
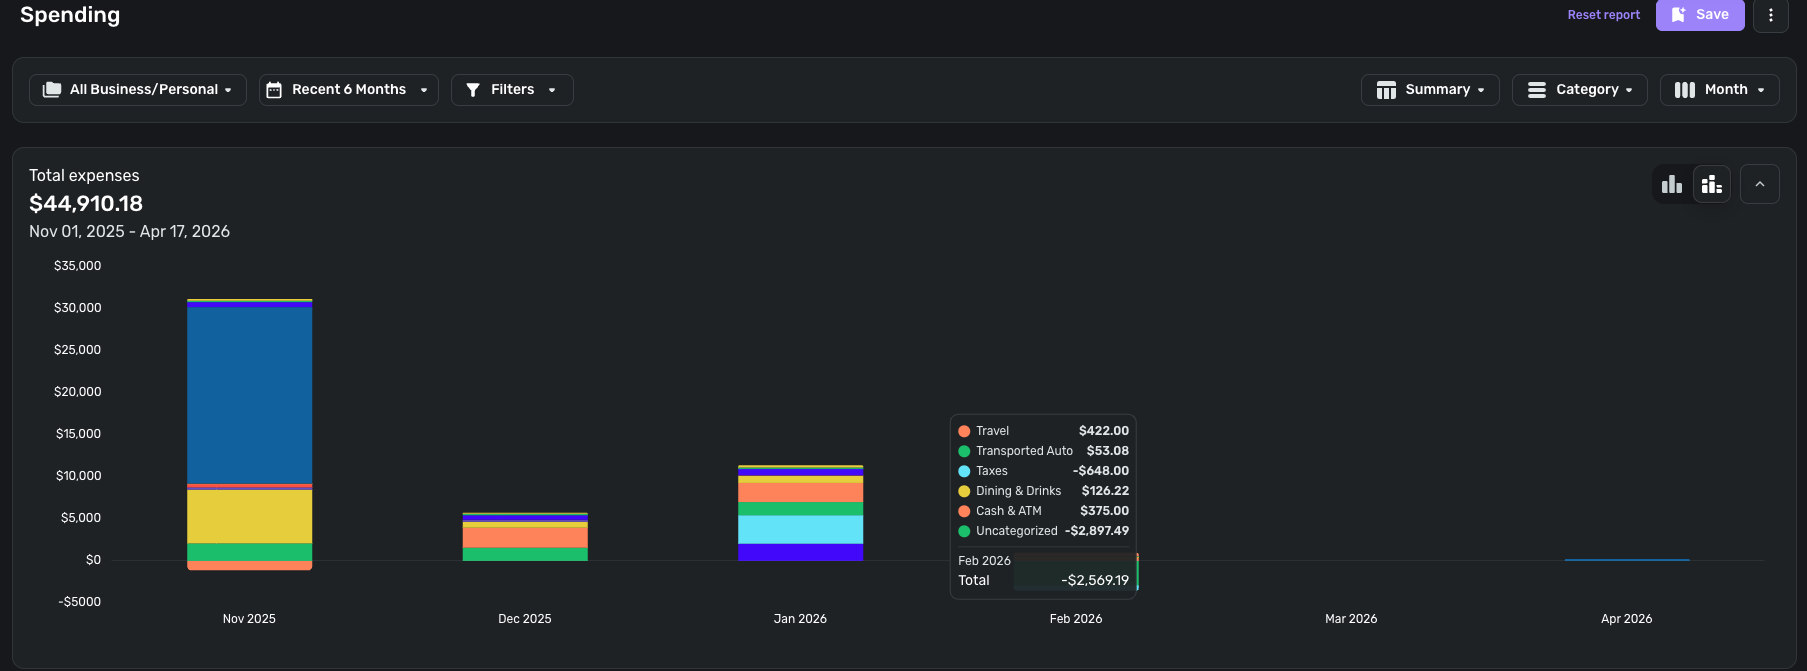
Thanks for the response. Before when I ran a Spending report, I could choose a 6 month time period and it would give me a pie chart by category like you showed. There was also an option to view "Over Time". When I switched to over time it could show a bar chart with each bar representing one month. I could also filter by Category so I could see how much I was spending on Dining each month for example. I can no longer find that report with the app update. That is my most important report to view my trends in spending.
0 -
Hello @elishearn,
Thanks for the clarification. If you set the Spending report's date range to "Recent 6 months", and then change the report from "Transaction" to "Summary", it should give you the monthly bar chart you are looking for.
I hope this helps!
-Coach Jon
0 -
oh, ok, that does work but a bit confusing. Thanks for explaining
2