Chart is not updating to reflect transactions in manual asset account (edited)

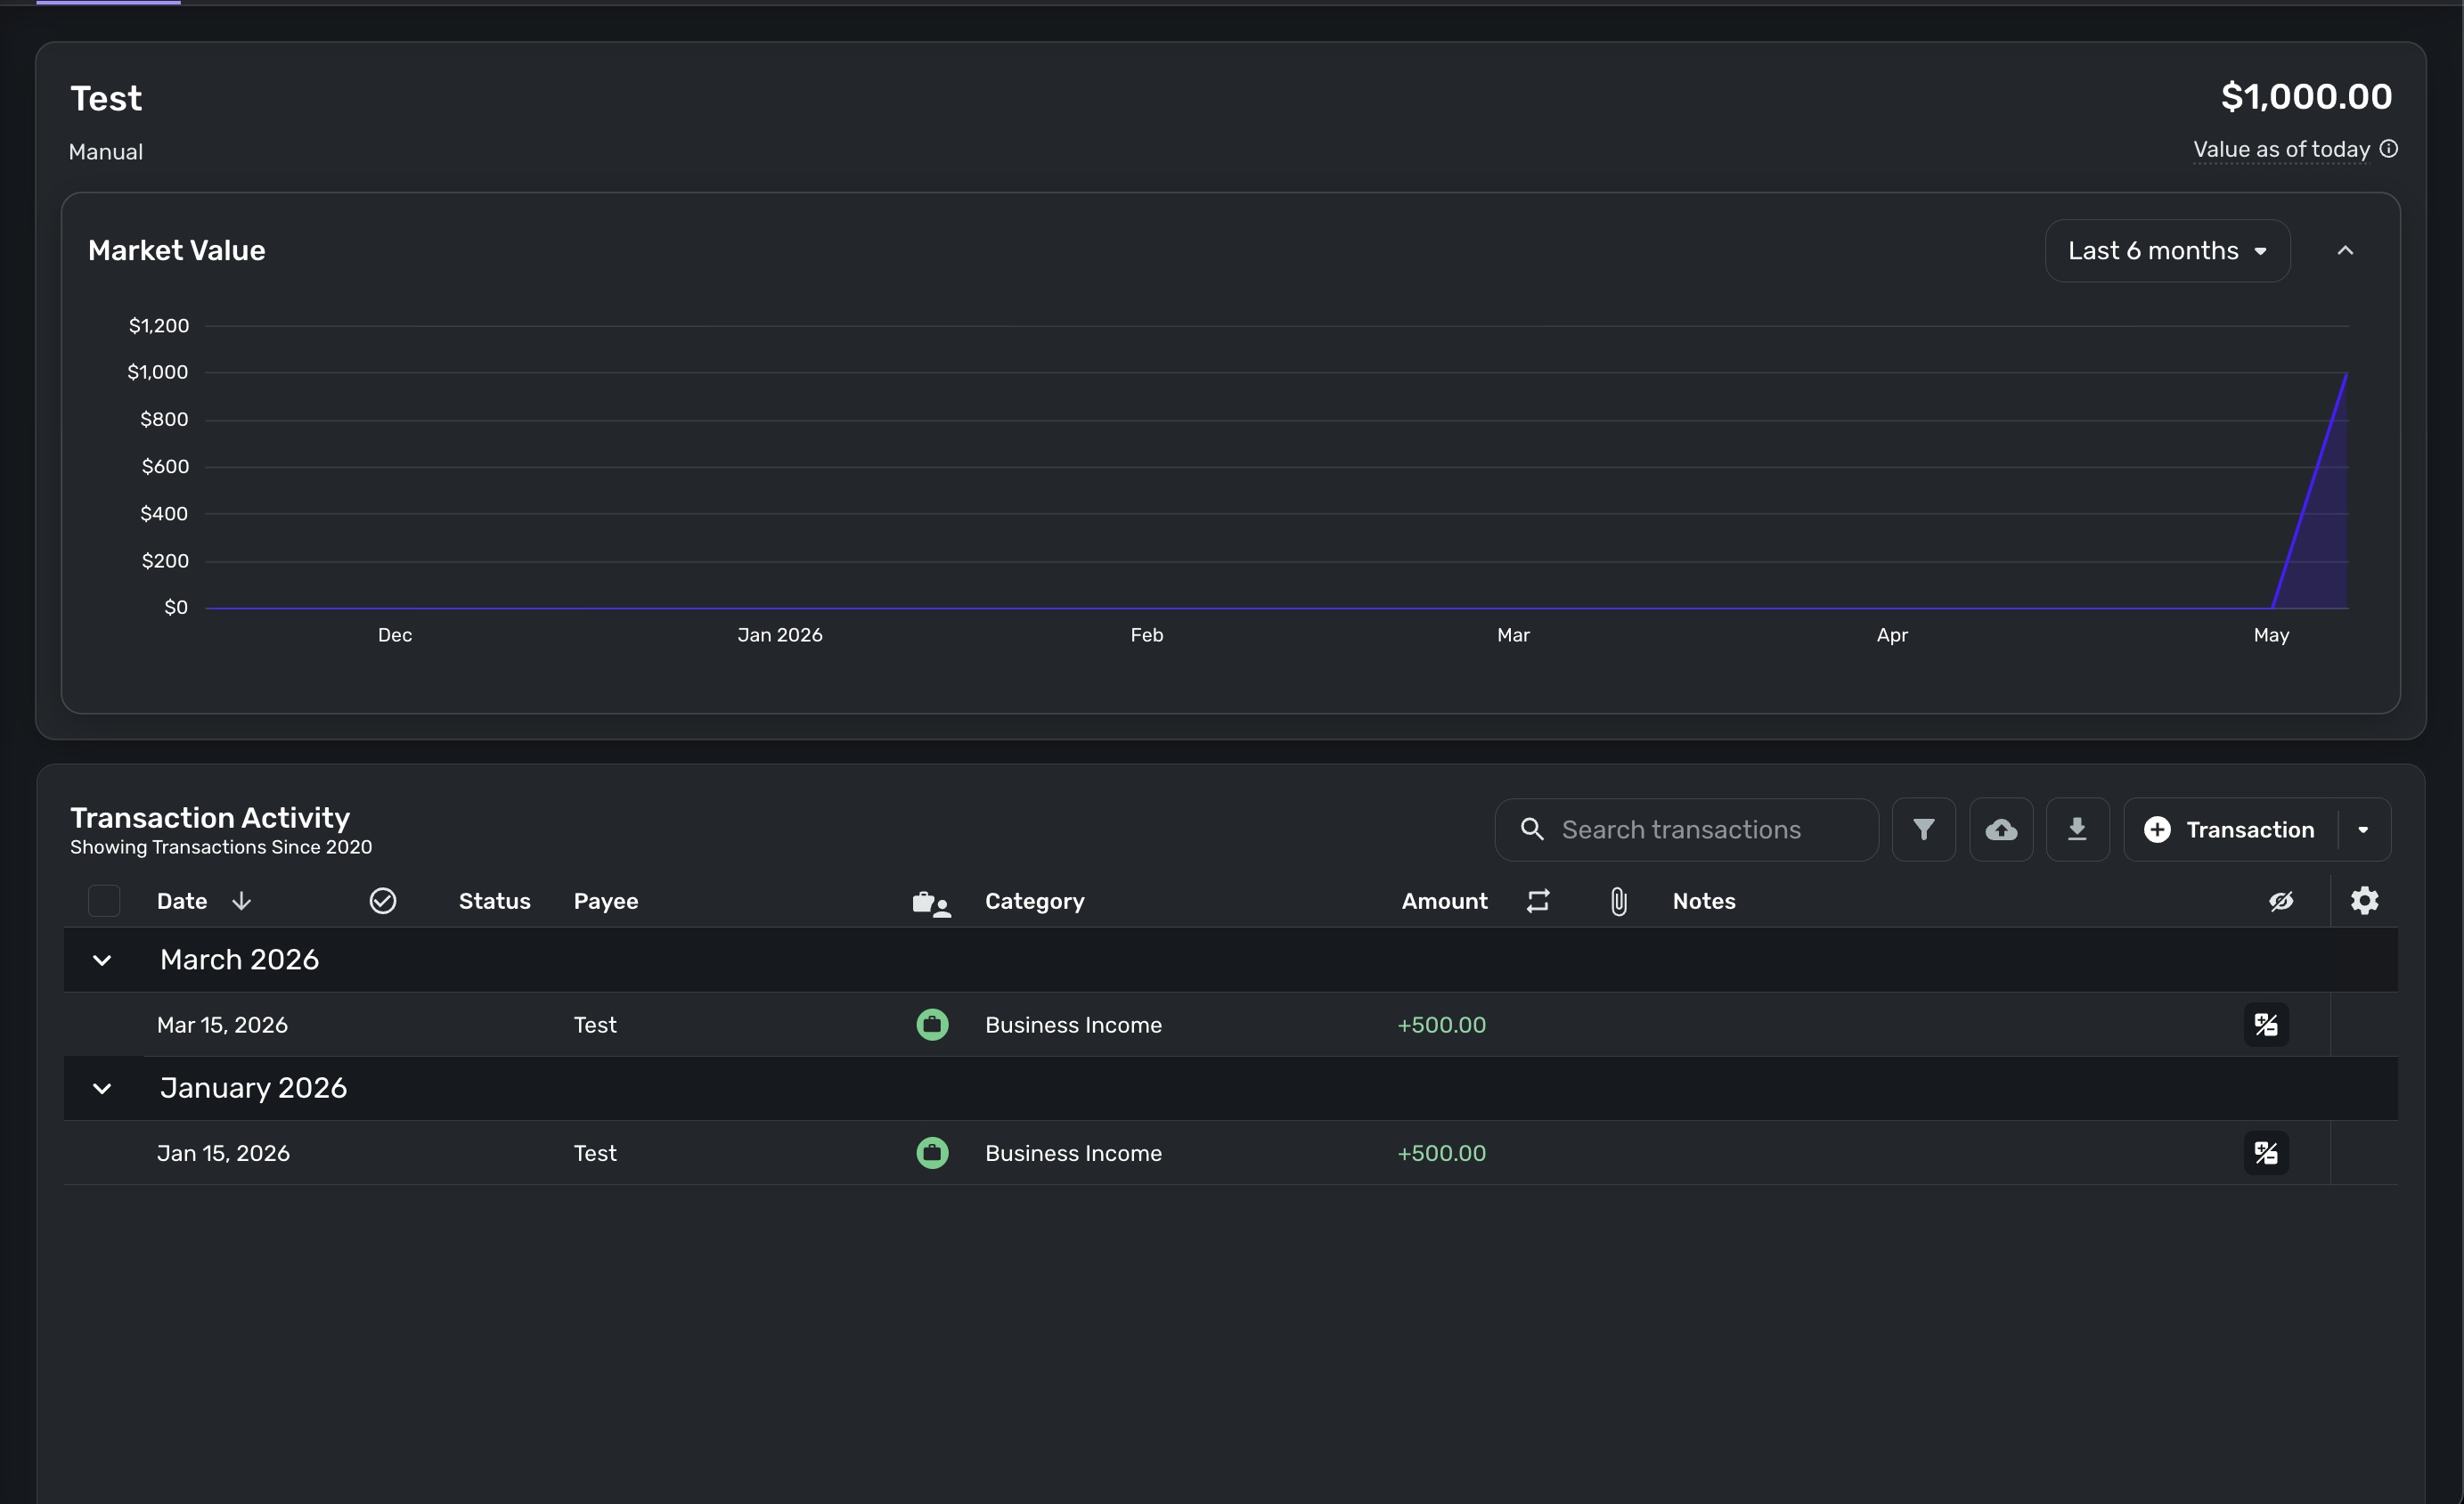
If you create a manual account for "Other Asset" and enter income transactions, the chart does not display them correctly across the timeline. It seems to only apply them to the last month in the chart but not the actual months they were entered. Looks like a bug of some sort. Pic below for reference. Notice the dates of the transactions and how the chart doesn't correspond to them.
Comments
-
Hello @cyberstackn,
Thanks for reaching out! With Quicken Simplifi, the report charts/graphs only show transactions that have been entered since the date of account creation. However, you can fill in the missing data in the chart by importing your account balance history. Our support article here explains how to do this:
Additionally, we do have an idea post that would allow users to start tracking balances from the date of the opening transaction, not just the account creation date. You can vote for and follow the idea post here:
I hope this information helps!
-Coach Jon
0 -
Hi Jon, thanks for the clarification.
I tried importing a CSV of the transaction history, but the chart still doesn't reflect the dates of the transactions.
I feel like charts should always default to reflect the dates of the transactions instead of the date of account creation.
Whatever you see in the transactions is what the chart should show.
I'm sure most users would agree.
Hope to see that fixed in the future!
Thanks
0 -
@cyberstackn, thanks for the reply!
You'd want to import account balance history, not transactions. The steps in this article will walk you through how to accomplish this:
I just tested in my own Quicken Simplifi by importing account balance history into a manual asset (vehicle) account, and the account chart updated to reflect this historical balance data.
Let us know how importing account balance history works for you!
-Coach Natalie
1 -
Hi Natalie, I just tried again and it did work this time. Not sure why it didn't work last time. I followed the guide and thought I did the Import Historical Balance option, but maybe I didn't. 😅
Is there any particular reason why the charts don't automatically reflect the transaction data?
If you create a new account and start importing transactions, even if some of them pre-date the day of account creation, it seems like the default behavior should be for the chart to reflect that data automatically without having to do a separate import of historical balance with a CSV.
Just curious if that is by design or if it's just a little glitch that hasn't been fixed yet.
0 -
@cyberstackn, although we wouldn't know why from a Community standpoint, I can confirm that accounts are intended to track balances from the time the account is added to Quicken Simplifi, not from the date of the opening transaction. This means that only transactions added after the account was connected or created would be included in balance tracking.
The Idea post shared by Coach Jon above would be the correct place to vote for a change to this:
I hope this helps!
-Coach Natalie
1