Add Percentages to Reports [edited] (1 Merged Vote)
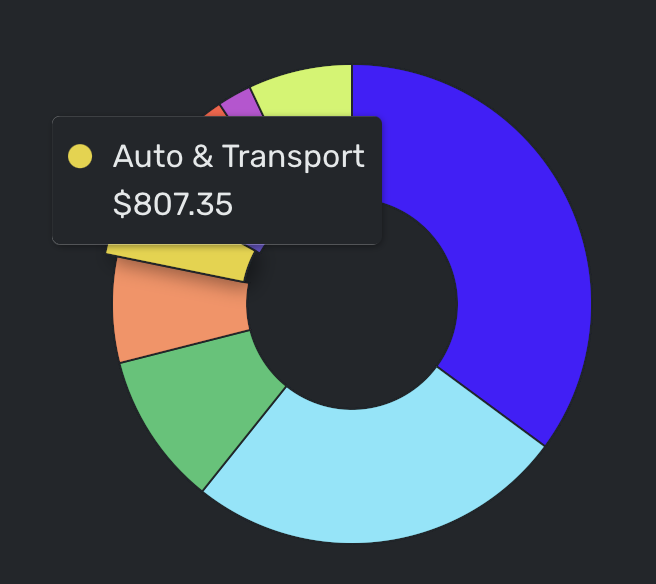
When looking at the Spending report, i think it would be good to see a percentage that category is taking up in the pie chart. following some budgeting rules, i like to generally say around 15% of my monthly income spend on food/groceries...i want to make sure im saving 15% of my income ....etc
Thanks!
Comments
-
The income and spending reports provide the amount spent for each category, payee, tag, etc. in total mode, but they don't provide the percentage of the total. That's a really important metric when analyzing spending.3
-
I found this post before posting it myself.
Showing the percentage in the reports (particularly spending) would be a very valuable insight.
Seems like this feature could be a quick win.Dan
Simplifi (2024-Present)
RocketMoney (2023-2024)
Simplifi (2022-2023)
YNAB (2014-2022)
Mint (2010-2014)
Quicken (1999-2010)1 -
This is not a top priority feature idea/suggestion, but something that could be helpful for those using a percentage of income budget method.
My suggestion is to add percentages to reports as shown in this screenshot:
I included my budgetary percentages in my category titles. Perhaps this could be a selectable feature when setting up expense categories. Then it would be cool to have the percentage shown next to the actual amounts spent in each category as seen in illustration.
This feature could be added to both the bar graph as above, and to the pie chart graph.
Danny
Simplifi user since 01/22
”Budget: a mathematical confirmation of your suspicions.” ~A.A. Latimer2 -
@DannyB ,
Just so I understand where these %'s come from, are they an included part of your Category naming structure (ex. "C- Food & Household (13%)"? Are they the amount you WANT/PLAN to spend? Do they always exist there, or did you just add them for this post?
At one point with Quicken Desktop, I did this - added goal %'s to the top level Categories in hopes of limiting spending. Didn't prove overly useful for me in Quicken Desktop; then again, Quicken Desktop WAS NOT overly useful for me. Simplifi is a much better fit!!!!
Chris
Spreadsheet user since forever.
Quicken Desktop user since 2014.
Quicken Simplifi user since 2021.0 -
- The percentages in this list are part of the title for each of these top level categories that I included when setting up my Category structure in Simplifi.
- The percentages listed are NOT a target but an actual breakdown of our spending in each category based on our annual living expenses over the past 6 (+) years. The 6 year time scale is based on when my wife and I started looking at what we really wanted/needed when retirement came upon us.
- Built into these percentages are both our month-to-month and annual costs for all fixed expenses and cushioned amounts for all our monthly and annual flexible spending based on annual averages.
- This is a unique scenario based on our personal lifestyle, values and habits and is a take off of one or another of the commonly published budget by percentage scenarios.
This was originally a feature request post that resulted from my post here which you have already read and responded to and was merged with an earlier feature request for the same feature. See my other post for more thoughts on percentage budgeting.
Danny
Simplifi user since 01/22
”Budget: a mathematical confirmation of your suspicions.” ~A.A. Latimer0 -
Enable users to toggle between dollars or % of spend for given time period in spending reports. Also give users ability to see spend % for each category vs total income in that period. Users could also be given option to provide data to enable estimate spend % relative to gross income for budgeting health feedback
3 -
Wondering if this feature is in the roadmap and any eta’s around release? Like @nanoviking wrote, having this toggle will be very helpful in understanding overall spend percentages in relation to overall monthly allocations to specific spend categories. Toggling between dollar and percentage like below screenshot:
2 -
While it is nice that the watchlists include percentages, it will be ideal if reports included a percentage option as well.
Simplifi User Since Nov 2023
Minter 2014-2023
Questionable Excel before 2014 to present
1 -
It would be helpful to display % to the pie and line graphs in addition to the dollar amounts in the "Reports" section.
0 -
For example, Percent of income for each category and to be able to see it in the spending plan and under reports
0 -
Hello, in Reports>Total Expenses when I hover over the grahps I'd love to see what % each expense category is of my entire expenses. Many financial advisors recommend certain % ranges for expenses categories and I'd like to be able to see instantly what mine are. Currently I have to do the math on my own calculator. Thank you!
0 -
This is similar to this existing feature request: [removed link to merged thread]
You can add your vote there also and I suspect your request will be merged with the existing request.
I agree, this would be great add.
Danny
Simplifi user since 01/22
”Budget: a mathematical confirmation of your suspicions.” ~A.A. Latimer0 -
Yes! Having a way to see the percentage each category represents would be a great feature.
The post showing a toggle seems like excellent idea to total between seeing percentage and total amount to keep the visuals clear. It could apply to both pie and bar chart formats.
0 -
I don't know if it's the statistician in me, but can we please add percentages to all the report and spending plan pie charts! It would be helpful to know how much were spending on household vs non essential expenses.
0 -
Great app! Do you have an ETA for the percentage feature?
0


