I see this is pretty old, but I am new to Simplifi and looking for the same feature. Ideally it should be a toggle on a per account basis. Also, it would be cool to show a second line in the graph view on the web app to include the forecast with and without savings goal transfers.
@RobWilk Changing the Savings Goal system to include a proposed date of the month to contribute to the goal doesn't seem unreasonable. For instance, I know that I'm going to contribute to my Savings Goals on the day after my first paycheck of every month (my first paycheck happens to be on the second Wednesday, which Simplifi also doesn't support, but that's another thread).
To me there are other, more problematic things. Presumably the users want the cash flow projection to stop adding in SG contributions after the goal is reached, which is doable but maybe not quite so easy…the target date of the goal doesn't change if you accelerate or decrease - or even "withdraw for another purpose" - contributions to the goal.
Also, there's the issue of when does the cash flow report that SGs will be added back to an account rather than withdrawn from it - when you withdraw from a goal "for it's purpose?" Some of my goals (I have one for Car Insurance, for example) I can definitively say what day of the year I'm going to withdraw from the goal (though frequently I won't know more than a couple of weeks in advance how much I will need to withdraw). But I also have a goal for Furniture which can be withdrawn from at any time. What is Simplifi supposed to do with that projection?
And all that is not even considering the issue that I have yet to see the app display correct information about SGs to begin with (mine are currently at least -$11 incorrect, which is closer than I've ever seen it).
@ajbopp I think my reply in December 2022 was to the wrong thread (I do that at times, and I'm not sure why, I've been trying to be more careful recently). Specifically, I seem to be talking about planned spending there, where the topic is about savings goals and cash flow chart.
I don't need this particular feature, but I'm not against it. When I transfer money to a savings goal, I transfer it to a savings account, and that will be reflected in the cash flow chart. I suppose Scheduling savings goal contributions would be nice separate from scheduling transfers. After that having a parallel "cash flow factoring in savings goals" chart "could" be interesting, but in my case, 100% of my savings account is typically intended to be in a savings goal.
It would be nice to see a line on the cash flow graph for how much is allocated to a savings goal to visually see the "available to spend" and see if you are ever going to dip below your savings goal.
For example, if I have $1000 saved in a goal for an account, I want to be able to predict if I will ever be below that in the account in the next 6 months.
I would like an option to show the projected cash flow account balances based on the available balance not the total, so it's obvious the savings goal is separated. And show the savings in the future transactions in the cash flow.
Possibly by selecting the available balance in the list accounts would take you to this view instead of going back up to the main account view that way both views are available. Like it's a sub-account.
Yes! I posted something similar last year. If you use savings goals heavily tied to you main cash flow account, the Projected Cash Flow graph is pretty much useless because you have to mentally subtract off what you have in savings goals in order for the graph to make sense.
I agree, when clicking on the Available Balance, switch the projected cash flow graph to show the balances which exclude the savings goal amounts.
If your savings goals are tied to a separate savings account, it probably won't matter much unless you have regular recurring withdrawals from savings.
True, but for those of us that tie them to our checking account, it does matter.
Yes, I could transfer savings goal cash over to savings for a whopping 0.2% interest, but for short term savings goals like maybe quarterly estimated taxes, it is not worth transferring back and forth. Plus I also like to have a "goal" that is really an overdraft buffer. And I would like to not see either of those in my Projected Cash Flow graph.
Agree, the amount shown in the bank should be deducted of the savings. I actually would like to see a net available amount which is the bank total minus the saving goals minus the credit card. I also have the issue with the quarterly property tax. I do not want to reset a goal every quarter. As an alternative I created a goal which will be slightly more than the quarterly tax and there is no goal date. It should work like a fund for property tax. Unless someone has a better idea how to handle this. Overall I do like Quicken Simplify.
I like the idea of having two cash flow projection lines, the existing one for Actual Cash Flow and a new one for Available Cash Flow. This is conceptually similar to the Balance and Available Balance in Transactions view.
As for how to calculate the Available Cash Flow, I don't think it needs to be over-complicated. It is, after all, an estimate. The amount at the start of the month would be equal to the "Available Balance" as shown in accounts. From there, the amount would be calculated just like the actual cash flow, but with two additions:
(1) the total of Savings Goals for the month is subtracted on the first day of the month,
(2) any money released from a Savings Goal is added back in when released.
You could get more precise by taking into account the dates and amounts of contributions to Savings Goals during the month, but for me it's not necessary. Available Cash Flow is just a rough guideline to keep me aware of how I should manage spending to meet my targets. It doesn't mirror anything in the real world.
I've been thinking about this since my last post, and I think there is a simpler way to calculate Projected Available Balance that might be quicker and easier to implement (and would still serve a purpose). The Projected Available Balance graph line could just be a graph of:
It's true that this would not show how your cash flow will be affected by future Savings Goal contributions. But the Projected Cash Flow doesn't really show what your actual future balances will be anyway. It ignores any expenses that aren't hard-coded into future Reminders/Series.
Essentially, this would cause the projection to treat future Savings Goal contributions just like future Planned Spending and future Other Spending in the Spending Plan. (Conceptually, that would work well with the redesigned Spending Plan that separates these 3 expense items out from Income and Bills.)
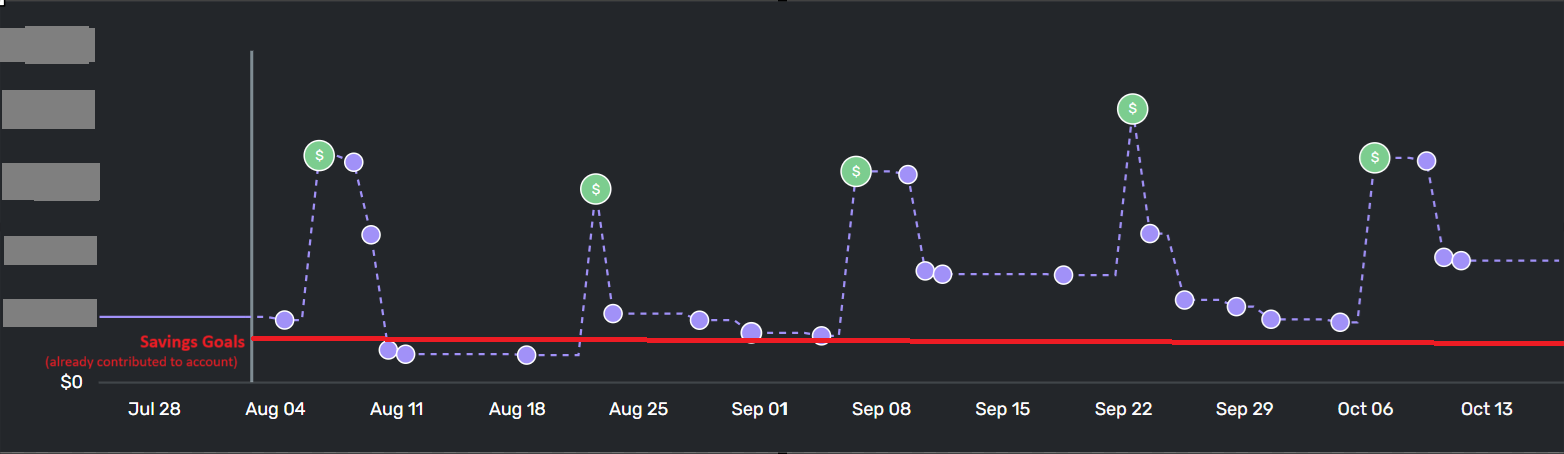
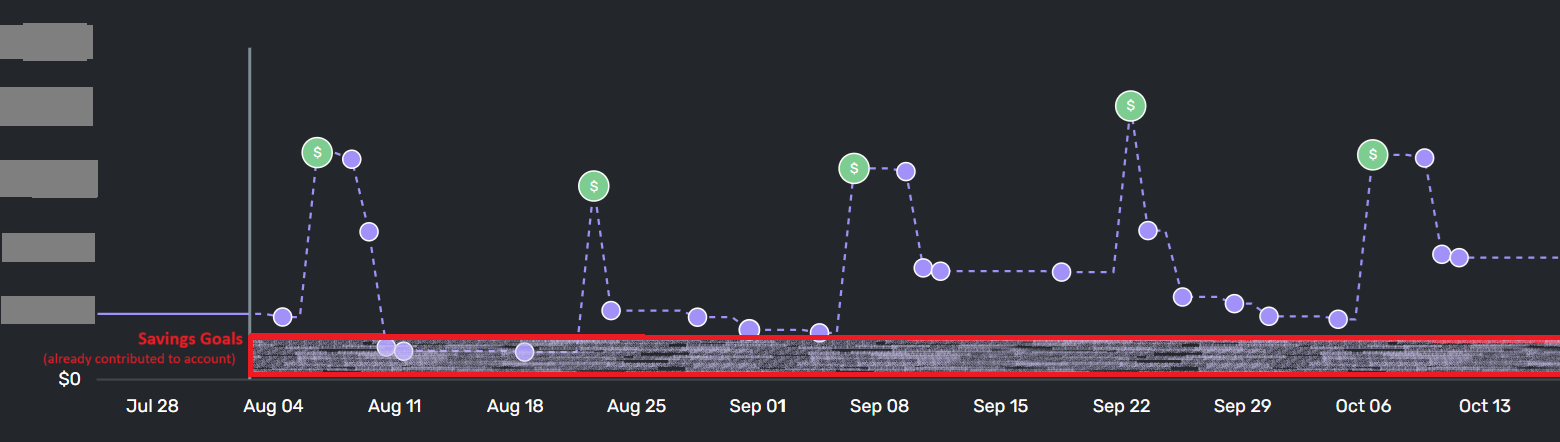
Having Savings Goal contributions (already made) shown on each account's Cash Flow chart would be SUPER HELPFUL! Right now I have to eyeball this. It'd be really simple chart-wise too. And since they already have the total Savings goal contributions number for each account calculated, it seems reasonable to add this to the chart. All you need is a horizontal line showing those Savings goal contributions or make it a shaded area on the chart. Here's rough examples of how it could be easily implemented (obviously make it look better than my horrible free Paint edited snips).
Edit: For context this is a Checking account where my Savings goals for it include the required min account balance and a small amount of $ I keep as "short-term Efund". I transfer my real "savings" to either investment accounts or High Yield/Money market savings accounts so they are earning at least 3+%. So I'm always working on Cash Flow management of this account to keep it right around that Savings goal line without dipping under. So having the Savings contributions line visual on the Projected Cash Flow graph would be really helpful as I'm adjusting future transfer estimates.
@silentdream
Your proposed Projected Cash Flow graphs with an added Savings Goals baseline (above) serve pretty much the same purpose as the "Projected Available Balance" graph line I proposed last month.
But I think your solution is clearer to look at and does a better job of conveying the idea that it is Savings Goals that make the difference. Overall, I think it's a much better solution.
I would prefer it be implemented just by adding one static horizontal line to the graph, rather than a shaded area. As a bonus, that static line could provide a use for the Savings Goal color from Spending Plan.😉
When you set aside money for a savings goal, you can take it out of the spending plan, but the account but the account forecast doesn't recognize it. It still shows your full amount. It would be nice to have a dotted line or something that shows the account balance minus the saved money towards goals so you don't spend it when making decisions about future balances.
I'm giving this a bump because I was looking at the Projected Cash Flow in my bank account for the new year.
Currently, I have to estimate how much the Savings Goals will grow over the timeline, considering contributions, then mentally take that into account when I look at what the Projected Cash Flow looks like.
It would be easier if there was a second line for Available Projected Cash Flow, below the main line, showing:
Is there any way to add a calendar chart of some kind that shows goals and projected cash flow as a goal is completed or changed and how that money that is freed up can be used for another goal?