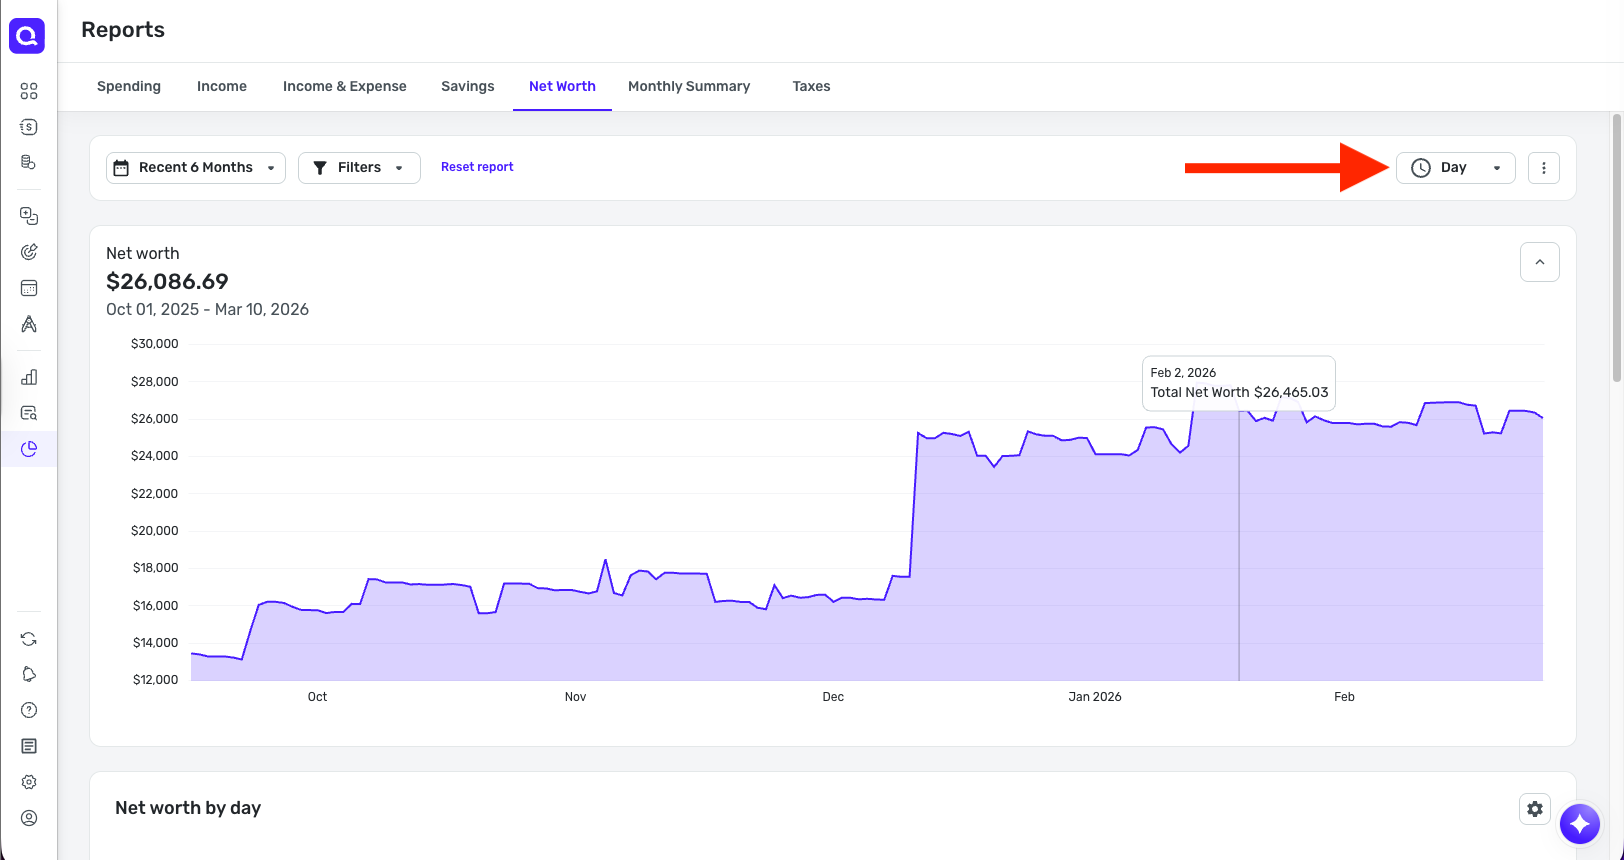
For a 3+ month view, please show a more granular (eg daily) breakdown of the graph. Having only 3 data points for a 3 month view isn't super helpful. Something more like the attached would be much more insightful. Would be great to have this as a widget on the dashboard as well. Thank you!