Report of Current Monthly Spending Compared to Average Over Time (edited)

Hello! I am really liking Simplifi.
The app already has a notificatiom which shares how much your spending compares to the average per month, but it only shows up periodically.
It would be great if the app could show this information whenever the user wants such as a report or a different representation of the spending plan.
A really neat way to show it is a line graph of current spending compared with the average line graph for linked the last (3, 6, X months). I find trying to beat my average month's spending to be big motivator!
Thanks!
Comments
-
-Coach Natalie
1 -
Also, it seems like the spending plan isn't updated if I modify the category of a transaction from a previous month. Is that true? if so, it would be nice if we could "refresh" it to get a more accurate view.
1 -
Hello @EL1234,
Thanks for the inquiry! To clarify, the Spending Plan is designed to just show info for the current month, so making changes to past month's transactions would not affect the current month's Spending Plan.
You can find more details regarding the Simplifi Spending Plan here.
Please let me know if you have any further questions regarding this!

-Coach Natalie
-Coach Natalie
1 -
I think I was looking at the "Monthly Summary" under Reports, where it shows you where last month's money went. Does that get updated if I change a category after the report was generated?
1 -
Hello @EL1234,
Thanks for the inquiry!
It looks like changing a category after the Monthly Report is generated does not impact the Monthly Report.
If this is something you'd like to see in Simplifi, you may consider creating a separate Idea post requesting it.
Thank you,
Coach Natalie
-Coach Natalie
1 -
Thanks!
0 -
I find I want to often try to answer the question "Where have I been unknowingly increasing my spending over time?" and the current Spending Report makes that kind of difficult.
<a href="https://ibb.co/Y2TKDDR"><img src="https://i.ibb.co/Y2TKDDR/app-simplifimoney-com-reports-spending-by-category-over-time.png" alt="app-simplifimoney-com-reports-spending-by-category-over-time" border="0"></a>- I can look at all categories and use the options: Breakdown: "By Category" and the "Over Time" view, but even then, I only get the top 4 categories, and the rest gets lumped into a catch-all category called "Everything Else". This is not so helpful because it makes drilling into "Everything Else" for more detail very difficult.
- The Filters don't allow me to just exclude the top categories one at a time to remove them from the view (unless I manually go in and select every single category one at a time first - which is very painful!)
- The Report also only shows the top-level category, with no way to drill down into sub-categories from there, which makes it impossible to see what sub-categories make up that larger spending category. Also, I'd like to be able to click on a category and/or month, and have it show only those transactions.
Basically, Mint.com's "Trends" page does all this stuff really well, but I'd like to avoid going back there just for this view, if possible, since Simplifi does so many other things better (and I'm paying for it!)
It shows more than 4 categories (which maybe works better since they only allow a single comparison, not a full month over month view).
<a href="https://ibb.co/xLH52yV"><img src="https://i.ibb.co/xLH52yV/mint-spending-by-category-report.png" alt="mint-spending-by-category-report" border="0"></a>
It even makes it easy to drill down into a category to see the subcategory breakdown over time.
<a href="https://ibb.co/3m5yPsr"><img src="https://i.ibb.co/3m5yPsr/mint-spending-report-shopping-drill-down.png" alt="mint-spending-report-shopping-drill-down" border="0"></a>
2 -
I'd like Simplifi Spending Report to work more like Mint's - it would make it much easier to answer the question "How (and in what categories) has my spending been changing over time?" (not just the big dollar categories, but any of them)
In Simplifi, it's hard to determine what categories are really contributing to spending, or where I'm increasing my spending over time in any given categories. Simplifi shows me only the top 4 plus "Everything Else" and drilling into Everything Else is hard since I can't exclude specific categories without manually selecting every category in the filter, and then unselecting the top 4 to see the next top 4, and on and on. A select all would be a nice step. But even better would be some kind of drill down clicking feature.
Also, I have sub-categories, and it's hard to know what sub-categories are contributing to changes in spending over time. It would be nice to click into a top-level category to see a drill-down view of the sub-categories.
Simplifi:
Mint:

I'd prefer to not have to go to Mint just for this view, since Simplifi does so many other things well, and I'm paying for it too!1 -
Hello @scottnliz,
Thanks for posting this to the Community!
I have gone ahead and turned this into an Idea post so that other Users can vote on it, and our Product Team can review it. Please be sure to add your vote as well!")
-Coach Natalie-Coach Natalie
1 -
Please be sure to add your votes here if you'd like to see the "Everything Else" bucket removed from Reports -- https://community.simplifimoney.com/discussion/1702/get-rid-of-everything-else-and-show-all-categories-on-the-spending-report-graph-edited

-Coach Natalie
1 -
I added my vote to the other one you linked, but it doesn't cover everything I asked for here. The main thing I'd like to see is category exclusion list based filtering so you could specify specific categories to remove from the report, rather than having to pick every category to include.2
-
I have a similar but slightly different interest. I'd like to be able to analyze spending by category by showing spending by category (eliminate the "everything else"), showing average spend.
For example, I'd like to see ytd spending, this quarter spending, two-year spending, etc. -- all by category, showing averages. Example: I have a category called horses that varies considerably, and so in order to develop a budget I need to look at average monthly spending over time.
Their are several ways to design this, but in a nutshell, the software reports don't allow quick budget/spend analysis. Here's a concept that provides total actuals and averages:
Category / This month / this quarter / YTD / monthly avg YTD/ Monthly avg past 12 mos / past 24 mos
Horse $400 $1500 $7000 $1000 $1400 $1800
Groceries $500
Utilities $300
(Etc.)
Totals $1200 $$$ $$$
This report needs to show all categories selected, no "everything else" rollups.
Filtering improvement:
The reporting tool needs to make it easy to exclude categories also. Select all/allowing deselect on some categories would be very helpful. I have one category called "one-time-home" that I used for major purchases, and I'd like to see the select/deselect categories be improved.2 -
I'd like to see a better spending analysis report with better filtering, and showing all categories. This report would show spending trends and averages over time, by category. In one report you can see trends and totals over time.
Better filtering needs to have a quick mechanism to select all/then deselect categories. I have a category called "one-time home", for major projects, and I'd like to be able to quickly de-select that category.
Report example (not very pretty but I hope the concept is clear):
Monthly averages:
Category / this month / this Qtr / YTD / AvgYTD -- AvgPast 12 mos -- AvgPast 24 mos
Horse $300 $3000 $10000 $1100 $1400 $1800
Groceries $100 $1500 $ 7000 $ $ $
Utilities $200 $ 600 $ 2000 $ $ $
(Etc.)
Totals $600 $4700 $19000
1 -
I'd like to see a report similar to the current spending report, but with a line graph showing my spending in a category over a period of time. This would allow me to gauge how much my grocery bill, for example, is increasing over time, and help me better project what I will need to spend on groceries in my Spending Plan.
Anthony Bopp
Simplifi User Since July 2022Money talks. But all my paycheck ever says is goodbye0 -
Seems like an obvious miss here, but there seems to be no way to easily see my total amount of spending in every category, per month, over time.
I.e.:

This is the foundation for setting up a budget—-Knowing what your current monthly expenditures are. Have asked several Chat reps on the site, and all say this isn't possible directly. Very surprising!
2 -
I would also like to see better spending trends graphs/reports! One I have seen in another solution is an interactive stacked area graph. It starts with showing spending over time at top tier categories, highlights the selected tier on the graph and also allows you to drill into the sub-categories and adjusts the graph to show an area graph of the sub-categories. I think this type of graph is visually appealing and easily helps you identify if categories are trending up or down over a period of time.
1 -
I am so frustrated that this still isn't an option 2 years later! This is such a basic requirement and I can do this in Excel. Considering cancelling my subscription this year :(
1 -
This has actually been an idea for 5 years. Sadly, the number of votes is pretty low. I had voted for this (probably years ago), but it's more of a "would be nice" for me than a "must have" in my case. Periodically replying to this, though, will bring the idea back to the front of the message/idea list and give it more visibility. Maybe others will consider this a good idea and vote for it too?
—
Rob Wilkens
1 -
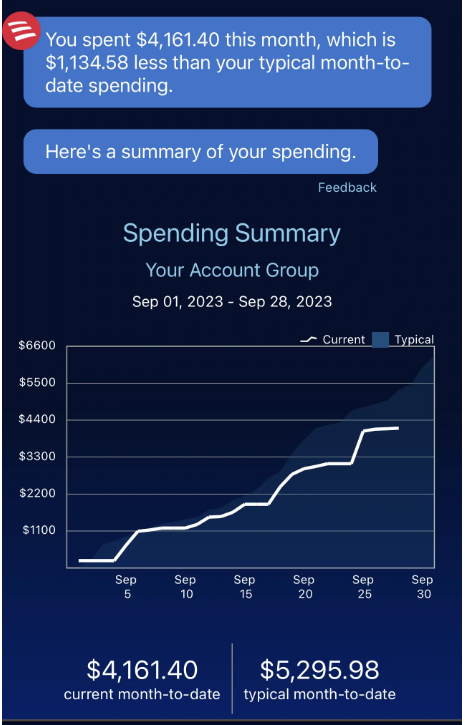
To help folks visualize this, here's a similar implementation from Bank of America that shows their "spendpath" that provides a Month-to-Date view.
**Note, this isn't my account. ;-)
 1
1 -
When using spending reports for any date range longer than one month, and I drill into one category such as groceries, I would like to see it by month and how compares to my spending plan and what the average spend is. Getting to this view in the income and expense report is not as straight forward and doesn't give the same visuals as the spending report.
2 -
would like to discuss this too
1 -
What I'm actually voting for is the ability to see sub-categories in the Spending > By Category > Over Time Report. It appears there have been a handful of conversations about this topic that have been merged, but it's not clear which conversation is the correct one to vote for.
1 -
Would be great to be able to "true up" my spending plan by easily seeing average spend over an adjustable period (3 / 6 / 12 months?) along with a total or min/max. Then I could go down the category list and update budgets, possibly switch to/from rollover if spend is spotty, etc.
1

