'Recent X Months' Date Range Filters in Reports should not include the current month (edited)

In the Reports Date Range date picker. If you choose Last month, Last quarter, or Last year you get a full month, quarter, or year. But f you choose Recent 6 months you get 5 months plus whatever days in the current month have come to pass. Like this:
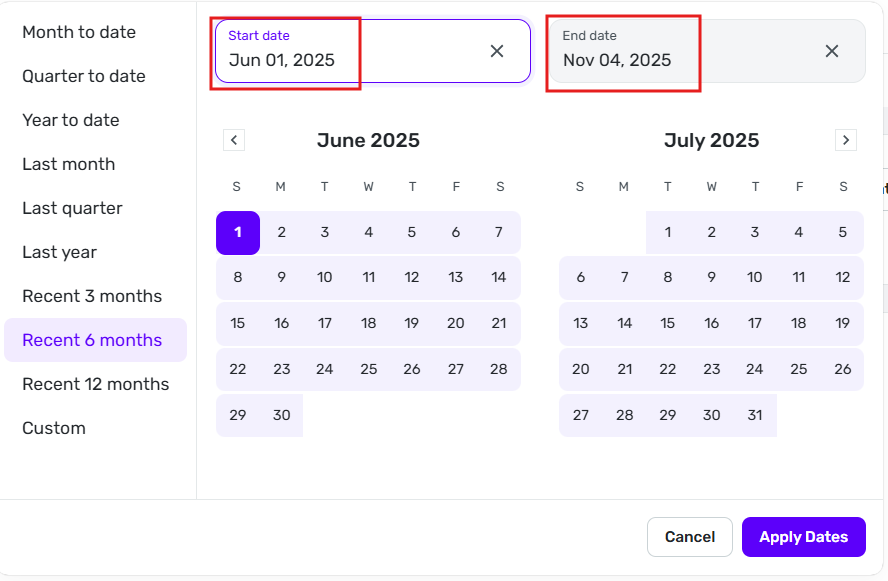
The Recent 6 months date range should return 6 full months. Not 5 months plus a few days in the current month. Same for the 3 and 12 month ranges. It's hard to compare trends in reports that show results in monthly columns when the last column only contains a few days.
This problem was discussed in the post below but that was closed without ever being converted to an Idea Post. It has also been discussed in posts related to Watchlists and Planned Spending.
DryHeat
-Quicken Classic (1990-2020), CountAbout (2021-2024), Simplifi (2025-…)
Comments
-
I voted for it; thanks for making the suggestion.
Steve
Quicken Simplifi (Safari & iOS) Since 2021
Quicken Classic (MacOS) Since 2009
MS Money (1991-2009) and Dollars & Sense (1987-1991)0 -
This is definitely a good idea!
0 -
My primary need in having the current month vs. previous months:
-I can't do anything to change the past, those months are over. So only seeing past month's is just 'interesting but not useful'.
-But I can look at my spending in the current month and compare it to previous months if the current month is included — i can do something about this month's spending for example if i see it's way off.
That's why I voted it down. Other people seem to like this idea, so if you do, vote it up.
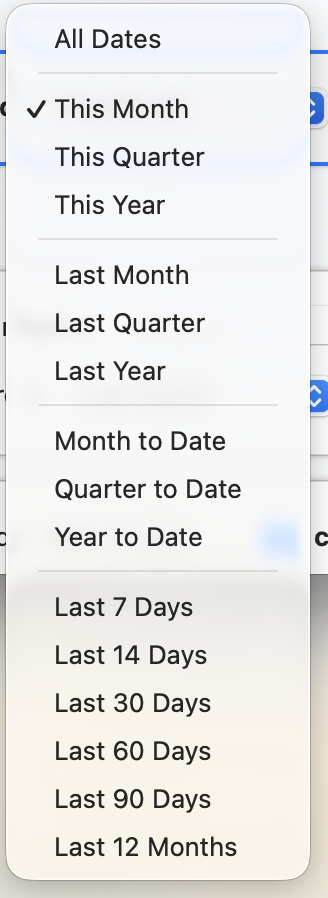
What would make it clearer? I totally would accept what I think i usually see in software like this over the years: "Last 30 days" "Last 60 days" "Last 90 days" "Last 120 days" "Last 365 days", whether or not that included 'today'.
—
Rob Wilkens
0 -
Regarding my last suggestion, I just checked, and that's what Quicken Classic does and this should do, IMHO.
—
Rob Wilkens
0 -
It depends what you're looking for. If you want an average of the last 6 months, a partial month will throw things off. Maybe there should be an option for each way in the filters.
0 -
@EL1234 Does the (i.e. spending) reports function give you an 'average' or do you do the math yourself? I've seen averages under spending plans and watchlists, but i never noticed them in reports. I am asking because i'd like to be able to turn this on if it's there. If it doesn't, offering it may be a good idea to introduce (presuming no one else suggested it).
—
Rob Wilkens
0 -
One other argument against the "monthly" reports (including for averages), Months can be 28, 29 (feb leap years), 30, or 31 days - that's about 10% potential difference in number of days - so when it's by month , it's never "apples to apples".
—
Rob Wilkens
0 -
One other argument against the "monthly" reports… Months can be 28, 29 (feb leap years), 30, or 31 days - that's about 10% potential difference in number of days - so when it's by month , it's never "apples to apples".
I get it that you don't like this idea ... But that's a bit of a stretch. Many expenses are monthly, not daily. And all the months but one have either 30 or 31 days.
There's a good reason why Simplifi has "Month" as one of the reporting intervals (and provides a Monthly Summary, and has a Monthly Spending Plan). And why all bookkeeping software provides monthly reports.
DryHeat
-Quicken Classic (1990-2020), CountAbout (2021-2024), Simplifi (2025-…)1 -
I was just sharing my opinions why I don't like it. I was making a case against it, but there is definitely a case for it. Part of the reason for idea posts are for pros and cons to be shared. Otherwise, there would simply be voting and no comments section.
BTW: I "get" that I'm the only down vote, and my opinion is only mine. It's 3 for 1 (me) against. It's sounding like more people like it the way you would prefer.
—
Rob Wilkens
0 -
I just checked and it doesn't. I was probably thinking about Spending Plan.
I still think though that perhaps the past 6 months should show 6 full months, so for example on July 15, show me transactions from Jan 15 - July 15. Especially if it's towards the beginning of the month and you want to get an idea of what spending you do in a specific category/ies over 6 months, to show the past 5 months plus a day or a few is misleading.
1 -
Jan 15-July 15 would be something like "Last 180 days", which i think is clearer than "Last 6 months" even though it is virtually the same thing.
To clarify: Is this idea post to "Exclude" the current month, or have 5 solid months with 1-2 partial months? If the latter, i might change my vote. Edit: if it is the latter, i may have misunderstood.
—
Rob Wilkens
0 -
To clarify: Is this idea post to "Exclude" the current month, or have 5 solid months with 1-2 partial months? If the latter, i might change my vote.
The idea is to exclude the current month and, for example, to show the previous 6 whole months.
The "Jan-15 to Jul-15" idea is a different suggestion. It would cover 6 months, but I'm not sure what column breakdown is being suggested. Would there be 7 columns (5 full months and 2 half months)? Or would each column cover from one mid-month to the next mid-month?
Personally, I think in months (like the Spending Plan). So for me that would be less useful.
DryHeat
-Quicken Classic (1990-2020), CountAbout (2021-2024), Simplifi (2025-…)1 -
I'm just thinking what someone would want to know if they asked, today, "what did I spend on gas in the last six months"?
Would they want to know June 1 - Nov 4? That's just a little bit over 5 months…
1 -
I think this post would make it May 1 - October 31, given that I am posting this in November. It would ignore the current month's spending.
Worth noting that the default for some reports is not 'over time' and instead is 'all in one chart'. For the case of the not over-time reports, would what you expect be different?
—
Rob Wilkens
0 -
That's the other approach that I think makes sense, especially if it breaks it down by month.
1 -
I changed my vote to yes. The more I thought about it, the more I came to a conclusion that :
(1) When comparing calendar months to calendar months, the whole month is more useful.
(2) If I wanted to extend it to the current date to see how this month is doing, I could edit it forward easily enough.
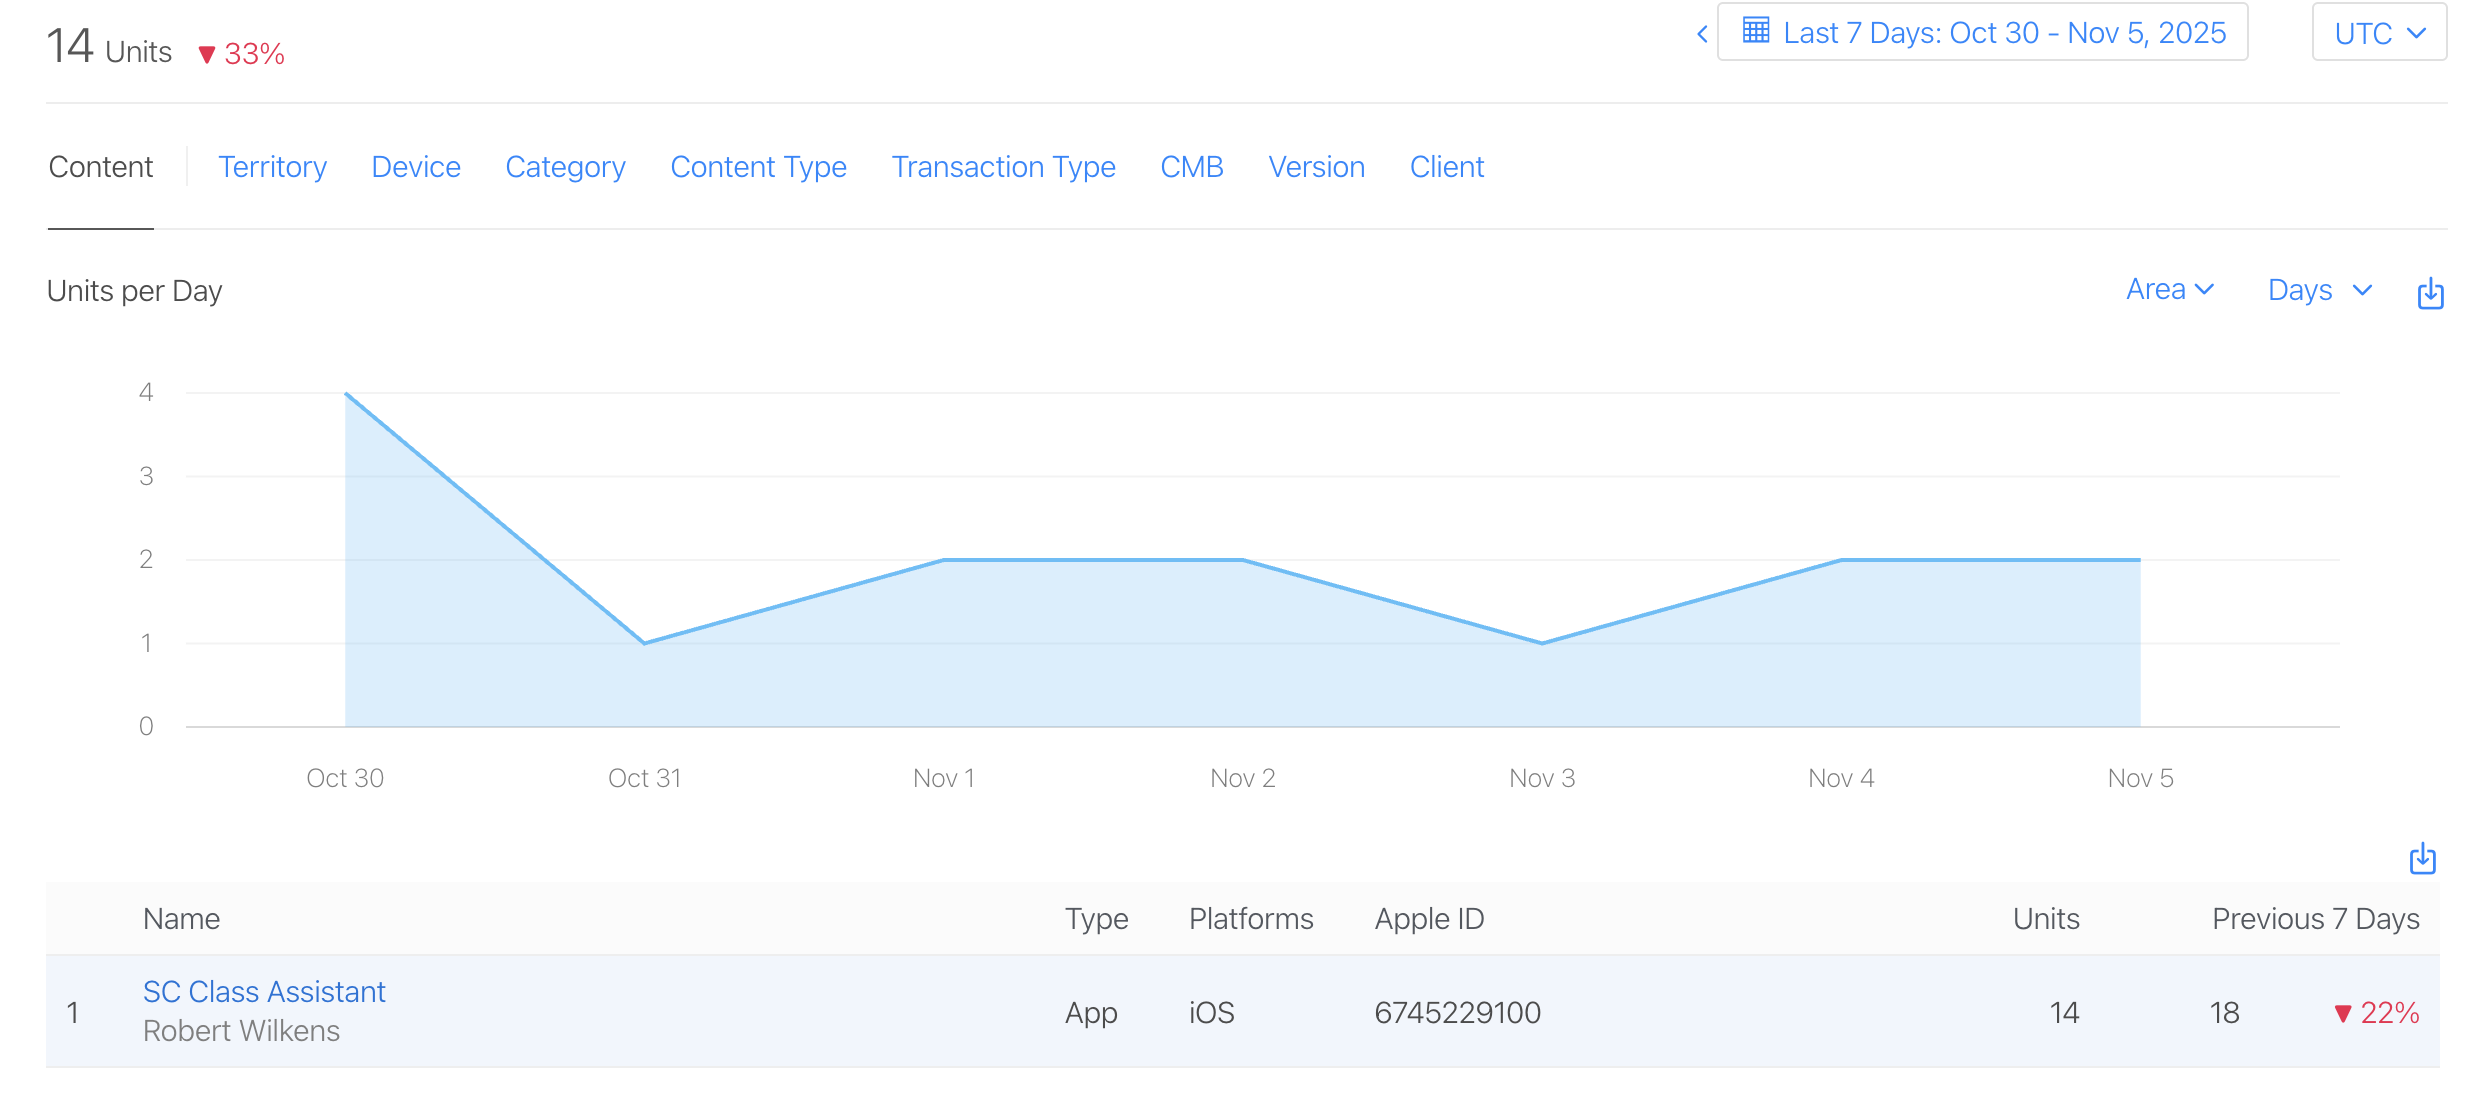
(3) I noticed even app store connect does something like this, but with days - it doesn't show partial days on the "last 7 days" chart. For example, and this is an easy example since my app's busy season (August-September) is over - this is not intended to be marketting, my app is not useful for anyone here, but i totally understand if it gets removed and the images themselves are just a similar kind of chart:
Note "last 7 days" looks like I had no "pro" sales:
But if I change my view to "Last 24 hours" I see one:
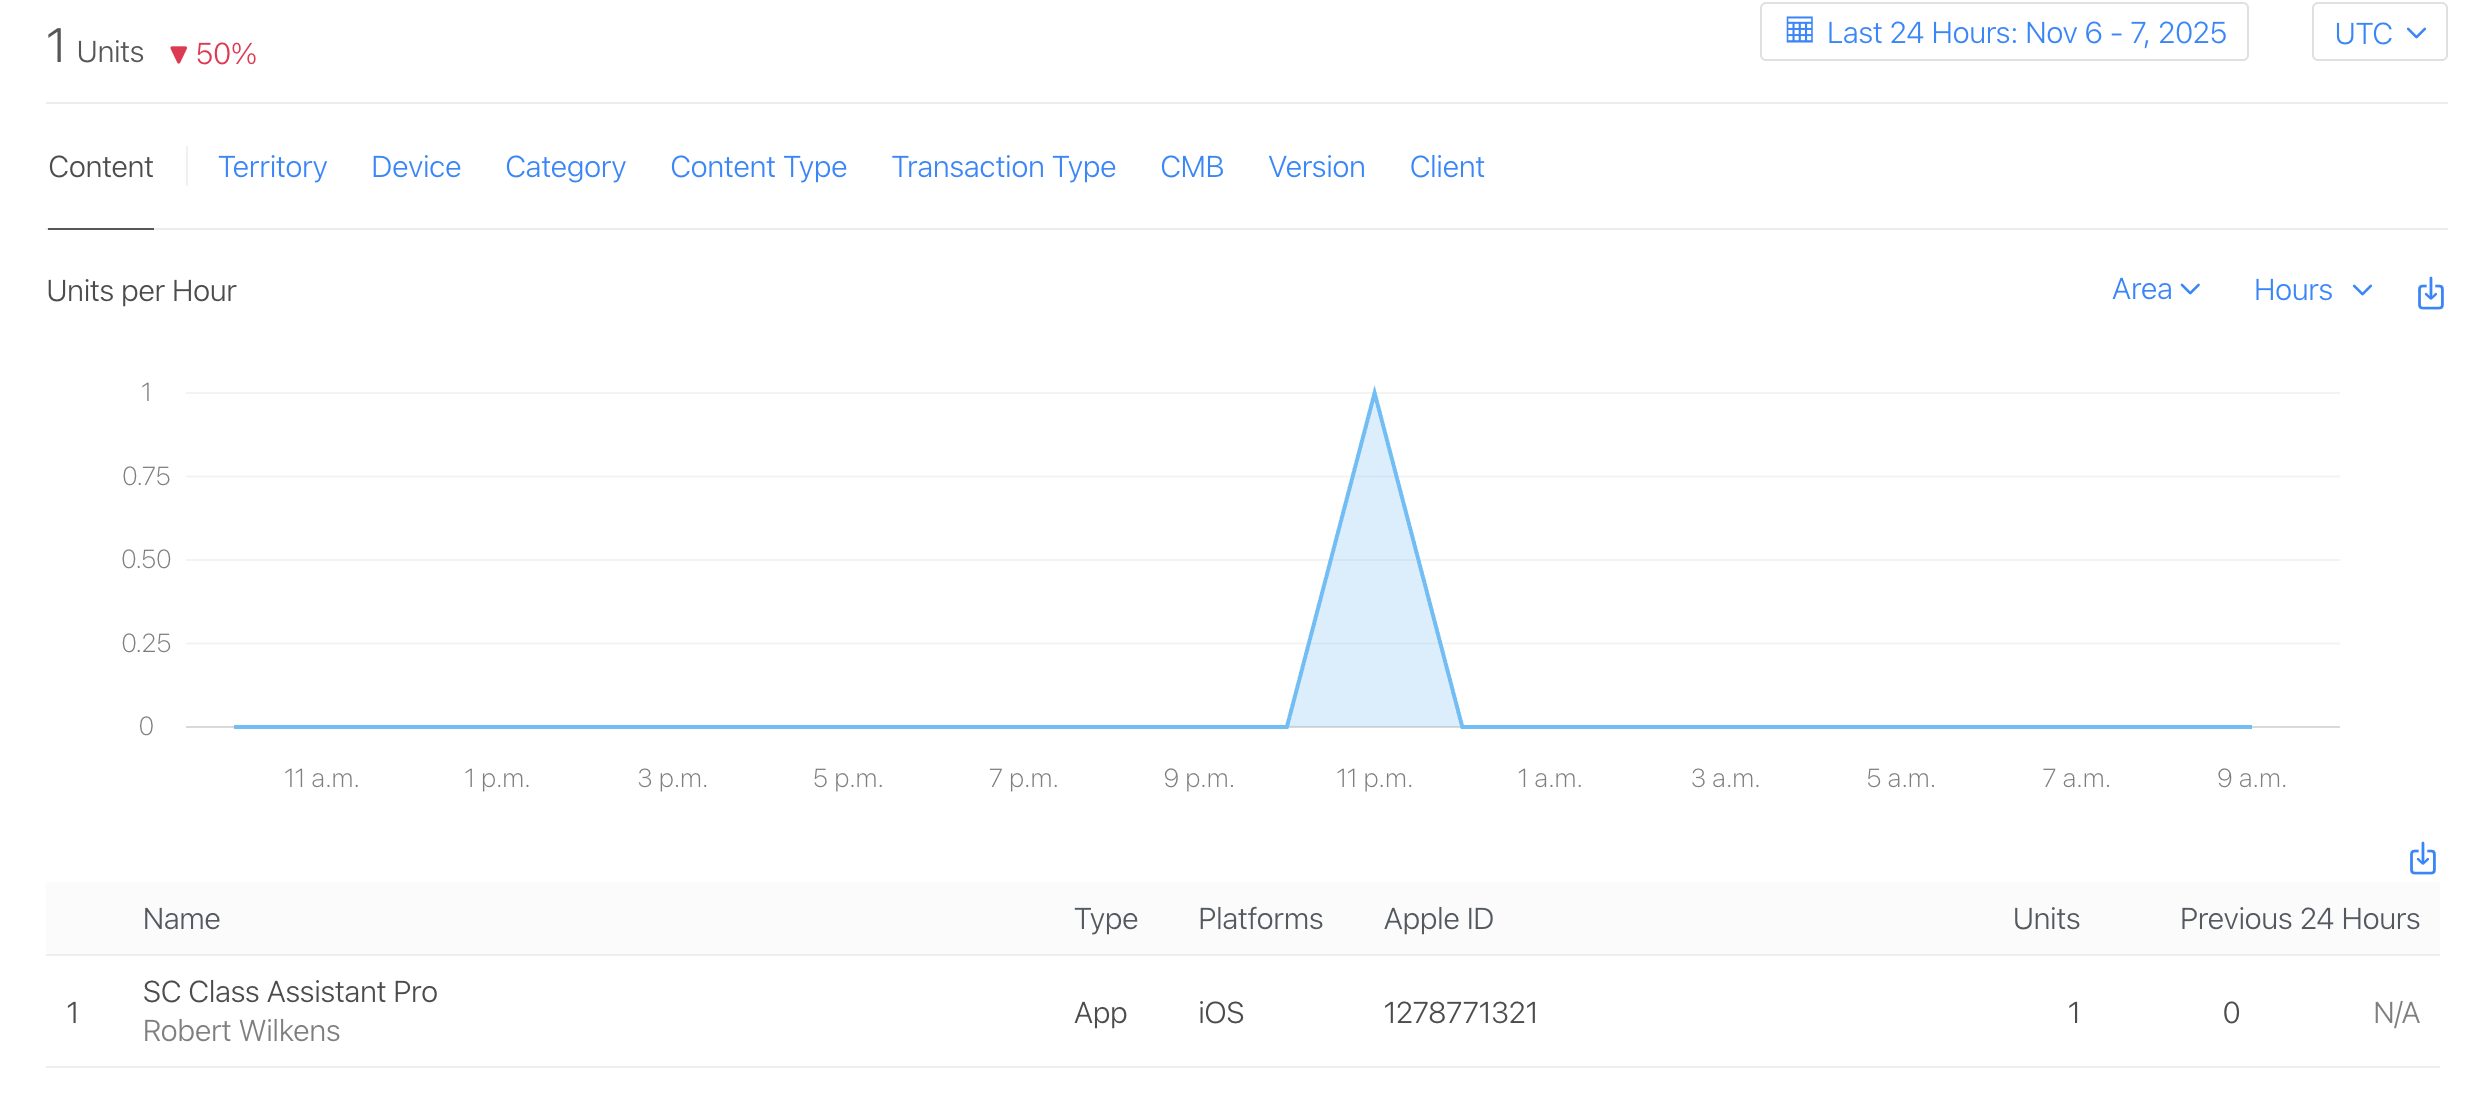
To give you an idea of the money I'm raking in from this project, that means I made around $5 this week, woo hoo, that's almost enough to buy a coffee at Starbucks!.
—
Rob Wilkens
1


